Washington D.C. Metro
Metro Area Overview
Market Trend Map
Metro Area Overview
The Home Demand Index (HDI) for the Washington DC metro area stands at 81 for this report period, down from 102 last month and below the 106 recorded during the same period one year ago. The twenty-one-point month-over-month decline signals a meaningful reversal from the spring recovery trajectory, as the demand momentum that had been building through the winter and spring months has rolled over more sharply than the prior-year seasonal pattern would suggest — a development consistent with the peak selling season reaching its ceiling and broader affordability and financing pressures reasserting themselves as buyer urgency fades entering early summer. The twenty-five-point year-over-year deficit is the widest annual gap observed for the DC metro in the current reporting cycle, indicating that the region is entering the summer period at a structurally softer level than the same period last year, with the market’s sensitivity to federal sector employment dynamics and elevated home prices contributing to a more cautious buyer posture than the underlying demand fundamentals of the region might otherwise support.
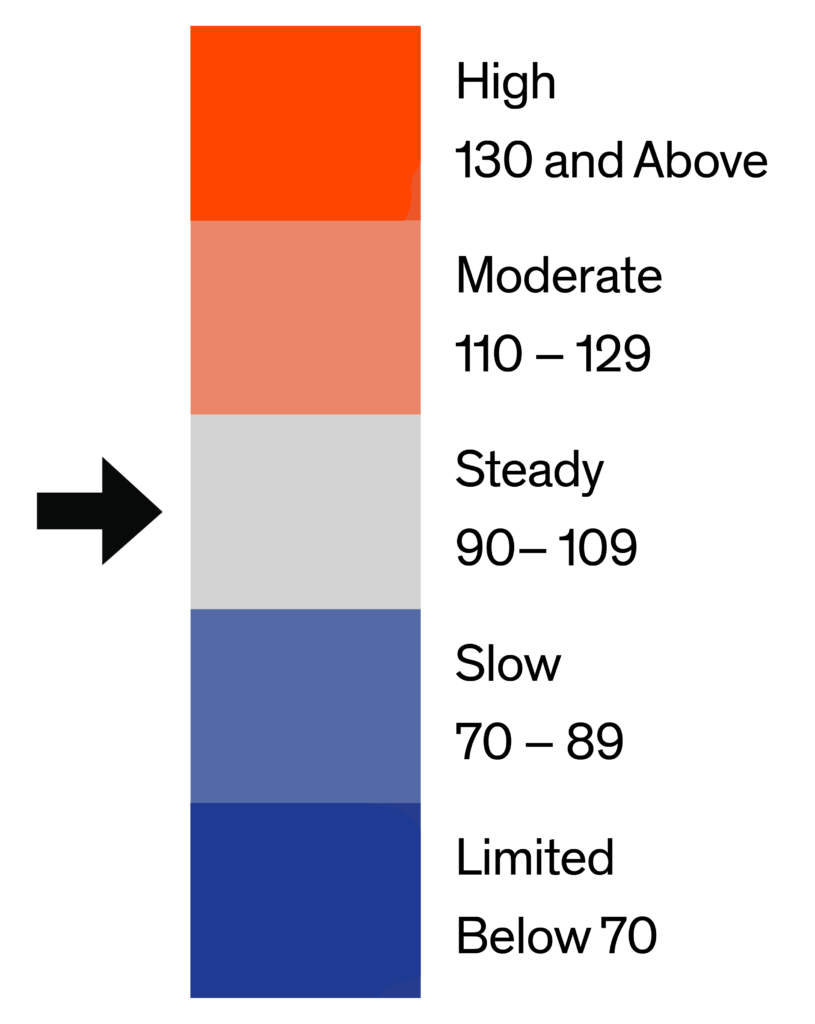
The market trend line, below, provides a high-level monthly overview of the Home Demand Index for each of the metro market areas within the Greater Washington D.C. Metro Area. The Home Demand Index is baselined at 100, with 90-110 indicating a steady market. Index values above 110 indicate moderate and high activity while Index values below 90 indicate slower or limited activity. For more information for a given period of time, click on any point on the map to pull up the monthly report.

Metro Market Trend Data by Bright MLS | T3 Home Demand Index
Each of the market areas listed above are defined as follows:
- Maryland-West Virginia Panhandle – Allegany, MD; Berkeley, WV; Garrett, MD; Grant, WV; Hampshire, WV; Hardy, WV; Jefferson, WV; Mineral, WV; Morgan, WV; Pendleton, WV; Washington, MD;
- North Central Virginia – Caroline, VA; Clarke, VA; Culpeper, VA; Fauquier, VA; Frederick, VA; Fredericksburg City, VA; King George, VA; Madison, VA; Manassas City, VA; Orange, VA; Page, VA; Prince William, VA; Rappahannock, VA; Shenandoah, VA; Spotsylvania, VA; Stafford, VA; Warren, VA; Winchester City, VA;
- Southern Maryland – Calvert, MD; Charles, MD; Saint Marys, MD;
- Washington D.C. Metro – Alexandria City, VA; Arlington, VA; Fairfax, VA; Falls Church City, VA; Frederick, MD; Loudoun, VA; Montgomery, MD; Prince Georges, MD; Washington, DC;
Market Trend Map
The Market Trend Map for the Washington D.C. Metro pulls the county map from the monthly reports and combines to provide a time-lapse of the overall market. Use the navigation at the bottom to toggle between months.

Washington D.C. Metro County-Level Market Trend Map | Home Demand Index
Current Market Report
Last 6 Market Reports
Historical Market Reports
Data Download
Washington D.C. | June 2026
Home Demand Index
The Home Demand Index (HDI) for the Washington DC metro area stands at 81 for this report period, down from 102 last month and below the 106 recorded during the same period one year ago. The twenty-one-point month-over-month decline signals a meaningful reversal from the spring recovery trajectory, as the demand momentum that had been building through the winter and spring months has rolled over more sharply than the prior-year seasonal pattern would suggest — a development consistent with the peak selling season reaching its ceiling and broader affordability and financing pressures reasserting themselves as buyer urgency fades entering early summer. The twenty-five-point year-over-year deficit is the widest annual gap observed for the DC metro in the current reporting cycle, indicating that the region is entering the summer period at a structurally softer level than the same period last year, with the market’s sensitivity to federal sector employment dynamics and elevated home prices contributing to a more cautious buyer posture than the underlying demand fundamentals of the region might otherwise support.
Demand by home type in the Washington DC metro during this report period reflects a broad cooling trend across segments, with varying levels of softness observed throughout the market. Entry-level single-family homes register 68, reflecting the weakest segment and continued pressure from affordability constraints, while the mid-range segment at 76 also indicates softer conditions in the core move-up market. In contrast, luxury single-family homes at 104 show comparatively more resilience, suggesting steadier high-end demand relative to other segments. Entry-level condos at 93 and luxury condos at 95 reflect more stable attached housing conditions relative to single-family segments, though still at softer levels overall. Townhomes and rowhouses at 83 indicate broadly slower activity, aligning with a metro-wide cooling pattern and pointing to a more cautious and measured market environment this report period.

Monthly Statistics for June 2026
Home Demand
Index
Index
81
(Slow)
Home Demand Index
from prior month
from prior month
102
Home Demand Index
from prior year
from prior year
106
Index change
from prior month
from prior month
-20.6%
Index change from
same time last year
same time last year
-23.6%
Bright MLS | T3 Home Demand Index
www.homedemandindex.com
Washington D.C. | May 2026
Home Demand Index
The Home Demand Index (HDI) for the Washington DC metro area stands at 98 for this report period, up from 95 last month but slightly below the 102 recorded during the same period one year ago. The three-point month-over-month increase reflects a modest uptick in buyer activity as the market continues to transition into the spring season. This gradual improvement indicates steady engagement rather than a sharp surge in demand. However, the four-point year-over-year gap suggests that activity remains just below last year’s pace. Overall, with demand holding within the Steady category, the market reflects stable conditions, with consistent buyer interest supporting a balanced and measured pace of activity as the season progresses.
Demand by home type in the Washington DC metro reflects mixed performance this period, with overall conditions showing uneven strength across price segments. Entry-level single-family homes stand at 85, indicating stable but constrained activity consistent with affordability pressures in the lower-tier market. Mid-range single-family homes rise to 90, reflecting improving momentum in the move-up segment and signaling one of the stronger areas of demand within the single-family category. Luxury single-family homes register 133, showing the most pronounced strength among single-family tiers and pointing to continued interest in higher-end properties despite broader market sensitivity. Entry-level condos stand at 115, reflecting moderated activity while still serving as a key affordability channel in the metro. Luxury condos at 125 show firmer engagement at the upper end of the condominium market, though demand remains uneven across segments. Townhouses and twin homes at 98 indicate broadly stable conditions with modest softness relative to other property types, highlighting a more measured pace in this middle-housing category.
Monthly Statistics for May 2026
Home Demand
Index
Index
98
(Steady)
Home Demand Index
from prior month
from prior month
95
Home Demand Index
from prior year
from prior year
102
Index change
from prior month
from prior month
3.2%
Index change from
same time last year
same time last year
-3.9%
Bright MLS | T3 Home Demand Index
www.homedemandindex.com
Washington D.C. | April 2026
Home Demand Index
The Home Demand Index (HDI) for the Washington DC metro area stands at 91 for this report period, up from 78 last month but still below the 98 recorded during the same period one year ago. The thirteen-point month-over-month gain signals a strong spring rebound in buyer activity, marking a shift from the slower winter months to a more dynamic market. This significant improvement suggests that pent-up demand is converting into active market engagement. However, the seven-point year-over-year deficit indicates that the DC market has yet to fully recover to last year’s level. Despite this, the current pace of recovery, supported by the region’s resilient demand fundamentals, points to the potential for further alignment with prior-year benchmarks as peak season conditions develop.
Demand by home type in the Washington DC metro shows broad-based spring improvement this period, with all segments posting month-over-month gains and several approaching prior-year levels. Entry-level single-family homes rose to 83 from 77 last month but remain slightly below last year’s level, signaling improving first-time buyer engagement. Mid-range single-family homes advanced to 77 from 63 last month but also trail last year’s level, reflecting steady spring momentum in move-up activity that has not yet fully returned to prior-year pace. High-end single-family homes climbed sharply to 110 from 80 last month but remain well below last year’s elevated level, indicating a strong seasonal reactivation in luxury demand while discretionary sensitivity continues to influence year-over-year performance in this segment. Entry-level condos increased to 115 from 102 last month and remain slightly below last year’s level, continuing to serve as a key affordability outlet in a high-cost market where attached housing remains a primary entry point for buyers. High-end condos rose to 119 from 114 last month but are meaningfully below last year’s level, suggesting improving momentum but a slower recovery in premium attached demand relative to prior-cycle conditions. Townhouses, rowhouses, and twin homes advanced to 93 from 82 last month but remain modestly below last year’s level, reflecting solid spring reactivation in a segment that continues to benefit from its balance of space, location efficiency, and relative affordability across the metro.
Monthly Statistics for April 2026
Home Demand
Index
Index
91
(Steady)
Home Demand Index
from prior month
from prior month
78
Home Demand Index
from prior year
from prior year
98
Index change
from prior month
from prior month
16.7%
Index change from
same time last year
same time last year
-7.1%
Bright MLS | T3 Home Demand Index
www.homedemandindex.com
Washington D.C. | March 2026
Home Demand Index
The Home Demand Index (HDI) for the Washington DC metro area stands at 75 for this report period, up from 69 last month and broadly in line with the 79 recorded during the same period one year ago. The six-point month-over-month gain reflects a meaningful spring reactivation in buyer activity, marking one of the more pronounced early-season recoveries across the three metros covered in this report. With the year-over-year gap narrowing to just four points, the DC market is tracking closer to prior-year demand levels than Baltimore or Philadelphia, suggesting underlying buyer engagement in the region remains comparatively resilient despite persistent affordability and financing headwinds.
Demand by home type in the Washington DC metro shows broad-based improvement from last month, with most segments advancing meaningfully and several posting readings competitive with or above year-ago levels. Entry-level single-family homes rose to 73 from 71 last month and above last year’s reading of 71, marking this segment as one of the few entry-level tiers in the region showing year-over-year improvement, consistent with sustained first-time buyer demand at accessible price points. Mid-range single-family homes advanced to 60 from 56 last month but remain below last year’s 66, pointing to move-up activity that is building momentum without yet reaching prior-spring levels. Luxury single-family homes posted a notable gain, rising to 76 from 63 last month, though still well below last year’s 98, suggesting high-end buyers are re-engaging selectively after a soft winter period. Entry-level condos climbed to 98 from 91 last month, slightly below last year’s 104, continuing to serve as an accessible alternative in one of the region’s higher-cost housing environments. Luxury condos rose to 110 from 96 last month but trail last year’s 128 by eighteen points, reflecting some moderation in premium attached demand from the elevated levels of early 2025. Townhouses advanced strongly to 78 from 71 last month and match last year’s reading of 78 exactly, indicating this segment has fully recovered to prior-spring demand levels and is well-positioned as a primary beneficiary of the metro’s spring buyer reactivation.
Monthly Statistics for March 2026
Home Demand
Index
Index
75
(Slow)
Home Demand Index
from prior month
from prior month
69
Home Demand Index
from prior year
from prior year
79
Index change
from prior month
from prior month
8.7%
Index change from
same time last year
same time last year
-5.1%
Bright MLS | T3 Home Demand Index
www.homedemandindex.com
Washington D.C. | February 2026
Home Demand Index
The Home Demand Index (HDI) for the Washington, D.C. metro area is at 66 in this report period, up from 53 last month and just below the 67 level recorded one year ago. This rebound reflects a notable pickup in buyer activity compared to the prior period, following several months of softer readings toward the end of the year. While demand has recovered on a month-over-month basis, the slight year-over-year gap suggests that purchasing activity remains constrained relative to last year, with affordability challenges and financing conditions continuing to limit the depth of buyer participation.
Demand across home types in the Washington, D.C., area shows mixed performance this report period. Entry-level single-family homes have limited supply, though demand is slightly higher than last year, while luxury condo and single-family homes have seen demand increase sharply from last month, suggesting renewed interest in the luxury segment. These shifts indicate buyers are responding selectively to available inventory, with activity concentrating where value and supply are better aligned.

Monthly Statistics for February 2026
Home Demand
Index
Index
66
(Limited)
Home Demand Index
from prior month
from prior month
53
Home Demand Index
from prior year
from prior year
67
Index change
from prior month
from prior month
24.5%
Index change from
same time last year
same time last year
-1.5%
Bright MLS | T3 Home Demand Index
www.homedemandindex.com
Washington D.C. | January 2026
Home Demand Index
The Home Demand Index (HDI) for the Washington D.C. metro area is at 51 for this report period, reflecting a decline from 70 in the previous month, which signals continued softer buyer activity. Compared with last year’s index of 51, demand is unchanged on an annual basis, indicating similar market conditions year over year. The market category falls under Limited, pointing to reduced buyer movement and quieter overall conditions.
Demand across home types in the Washington D.C. area is softening during this report period. Mid-market single-family homes show the largest pullback from last month, while entry-level single-family homes remain more resilient, slightly above year-ago levels. Luxury single-family homes see a notable decline compared with both last month and last year. Among attached homes, including townhouses, rowhouses, twin homes, and condos, demand is down across price points, with higher-priced condos posting the steepest year-over-year drop. Overall, demand is down due to limited inventory.
Monthly Statistics for January 2026
Home Demand
Index
Index
51
(Limited)
Home Demand Index
from prior month
from prior month
70
Home Demand Index
from prior year
from prior year
51
Index change
from prior month
from prior month
-27.1%
Index change from
same time last year
same time last year
0%
Bright MLS | T3 Home Demand Index
www.homedemandindex.com
Washington D.C. | December 2025
Home Demand Index
The Home Demand Index (HDI) for the Washington D.C. metro area is at 67 during this report period, showing a noticeable drop from 88 in the previous month. This shift points to softer buyer activity overall. Compared with last year’s index of 70, demand is slightly lower on an annual basis, indicating a mild pullback from the same period. The market category falls under Limited, indicating quieter conditions and reduced buyer movement.
Demand across home types in Washington D.C. is softening this period, with a sharp surge in mid-range single-family activity relative to last month. Entry-level single-family demand remains comparatively restrained versus recent levels, though it is positioned more favorably than a year ago. Luxury single-family homes show the steepest decline, while attached homes, including townhouses, rowhouses, and twin homes, and condos also post notable declines. The spread between mid-range and entry-level performance suggests buyers are concentrating more heavily in move-up price points where inventory and value alignment may be improving.
Monthly Statistics for December 2025
Home Demand
Index
Index
67
(Limited)
Home Demand Index
from prior month
from prior month
88
Home Demand Index
from prior year
from prior year
70
Index change
from prior month
from prior month
-23.9%
Index change from
same time last year
same time last year
-4.3%
Bright MLS | T3 Home Demand Index
www.homedemandindex.com
All reports for the Washington D.C. Market Area.
List of available data files. Note that the data file includes all data for the report period across the entire Bright MLS footprint.