The Bright MLS | T3 Home Demand Index rose nine percent in April to a reading of 157 reflecting a High level of demand for homes in the Washington MLS market area. The Index was significantly higher than one year earlier in large part due to the sharp drop in demand in earlier 2020 at the start of the pandemic.
An elevated level of buyer demand in the Washington market area was evident among most segments of the market. The Bright MLS | T3 Home Demand Index was in the High category for all types of homes except lower-priced single-family. Demand was strongest for higher-priced single-family homes and condos. With less than a one-month supply, the inventory of homes for sales was particularly low in the mid-priced single-family and townhouse segments which together accounted for 60 percent of sales in April.
Monthly Statistics for May 2021
Home Demand Index
157
(High)
Home Demand Index from prior month
144
Home Demand Index from prior year
96
Index change from prior month
9%
Index change from same time last year
63.5%
Bright MLS | T3 Home Demand Index
www.homedemandindex.com
Download tile as an image.
Embed this tile on your site.
Washington D.C. | May 2021
Home Demand Index | Historical Year-over-Year Comparison
Demand for homes in the Washington market area has risen strongly since the December seasonal low, apart from a one-month pause in February. The Index has already exceeded the peak level attained in October. Continued strength in demand is probable given signs of strengthening economic growth and favorable mortgage interest rates.
Home Demand Index
Bright MLS | T3 Home Demand Index
www.homedemandindex.com
Download the top-level Market Areas map as a screenshot.
Embed this tile on your site.
Washington D.C. | May 2021
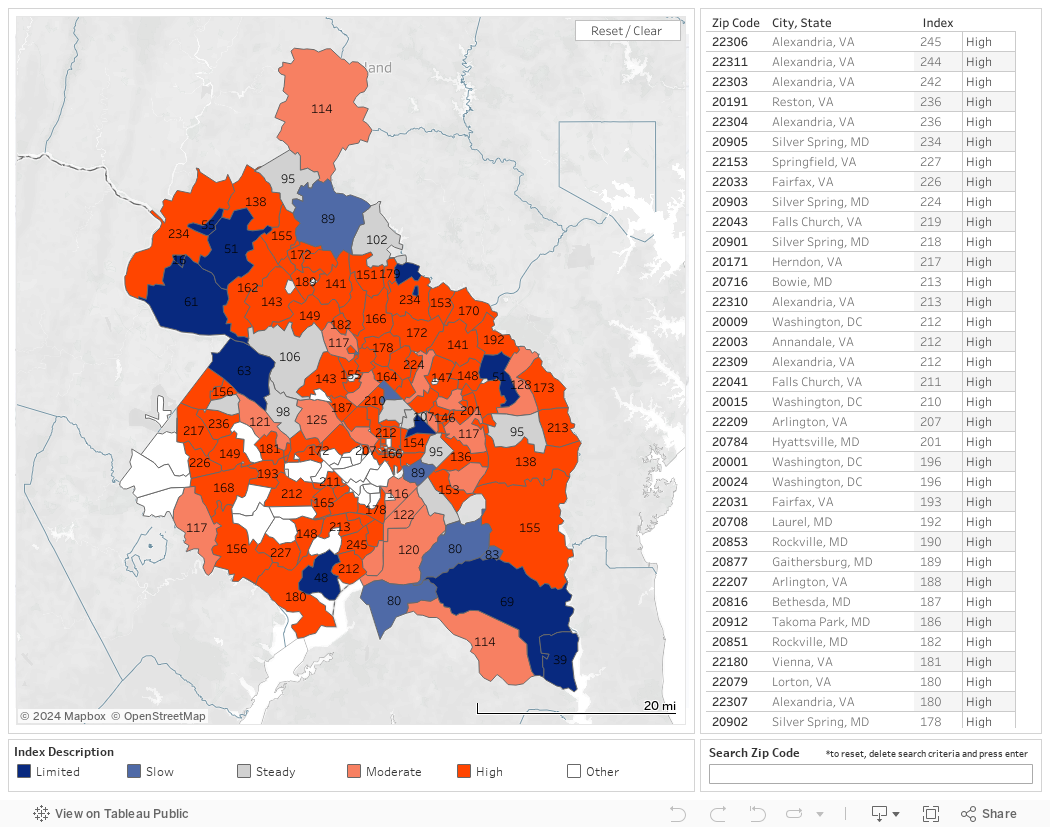
Home Demand Map
Two-thirds of ZIP codes in the Washington market area recorded an Index reading in the High category, up slightly from March. Demand in an additional 14 percent of communities was in the Moderate category. The few areas of Steady, Slow or Limited demand were scattered throughout the market area.
Bright MLS | T3 Home Demand Index
www.homedemandindex.com
Download tile as an image.
Embed this tile on your site.
Washington D.C. | May 2021
Demand and Inventory by Home Type
An elevated level of buyer demand in the Washington market area was evident among most segments of the market. The Bright MLS | T3 Home Demand Index was in the High category for all types of homes except lower-priced single-family. Demand was strongest for higher-priced single-family homes and condos. With less than a one-month supply, the inventory of homes for sales was particularly low in the mid-priced single-family and townhouse segments which together accounted for 60 percent of sales in April.
Bright MLS | T3 Home Demand Index
www.homedemandindex.com
Download tile as an image.
Washington D.C. | May 2021
Single Family Home Below $395k
Buyer interest in lower-priced single-family homes declined slightly in April and remained in the Slow category. During the past several months, demand for homes in this segment has lagged in other parts of the market even as overall demand has risen. Nonetheless, the inventory of homes available for sale has been low. In April, the month’s supply was 1.1, down marginally from the previous month.
Monthly Statistics for Single Family Home Below $395k
Home Demand Index
78
(Slow)
Home Demand Index from prior month
81
Home Demand Index from prior year
86
Months of inventory
1.1
Average daily inventory last month
352
Inventory sold last month
318
Bright MLS | T3 Home Demand Index
www.homedemandindex.com
Download tile as an image.
Washington D.C. | May 2021
Single Family Home $395k - $950k
The Bright MLS | T3 Home Demand Index for mid-priced single-family homes rose solidly over the month to a reading of 173. Inventory conditions have been particularly acute with sales in this segment more than 50 percent greater than the average daily inventory suggesting that homes were on the market for a matter of days. The month’s supply was just 0.7 in April, unchanged from the previous month.
Monthly Statistics for Single Family Home $395k - $950k
Home Demand Index
173
(High)
Home Demand Index from prior month
158
Home Demand Index from prior year
102
Months of Inventory
0.7
Average daily inventory last month
1,065
Inventory sold last month
1,633
Bright MLS | T3 Home Demand Index
www.homedemandindex.com
Download tile as an image.
Washington D.C. | May 2021
Single Family Home Above $950k
Demand for higher-priced single-family homes rose 27 percent in April, the sharpest rise among all types of Washington area homes. Furthermore, buyer interest was greater than any other segment with an Index reading of 263, well above the threshold reflecting a High level of demand. Would-be buyers were challenged when searching for a home with a month’s supply of 1.3, unchanged from the previous month.
Monthly Statistics for Single Family Home Above $950k
Home Demand Index
263
(High)
Home Demand Index from prior month
207
Home Demand Index from prior year
107
Months of Inventory
1.3
Average daily inventory last month
704
Inventory sold last month
556
Bright MLS | T3 Home Demand Index
www.homedemandindex.com
Download tile as an image.
Washington D.C. | May 2021
Condo Below $570k
In April, the Index for lower-priced condos was 175, up five percent over the month, reflecting a High level of demand. Buyer interest in lower-priced condos has been strong for several months in large part because of excessively tight inventory conditions in other similarly priced segments of the market. Would-be buyers found a two-month supply of homes available for sale, greater than any single-family segment.
Monthly Statistics for Condo Below $570k
Home Demand Index
175
(High)
Home Demand Index from prior month
167
Home Demand Index from prior year
90
Months of Inventory
2
Average daily inventory last month
2,262
Inventory sold last month
1,133
Bright MLS | T3 Home Demand Index
www.homedemandindex.com
This is Tooltip!
Washington D.C. | May 2021
Condo Above $570k
Buyer interest in higher-price condos, while accounting for only four percent of sales, rose 12 percent to a reading of 222. For buyers searching for a home at this price point, inventory conditions were more favorable than any other segment of the Washington market but, at 2.4 months, still challenging.
Monthly Statistics for Condo Above $570k
Home Demand Index
222
(High)
Home Demand Index from prior month
198
Home Demand Index from prior year
84
Months of Inventory
2.4
Average daily inventory last month
535
Inventory sold last month
227
Bright MLS | T3 Home Demand Index
www.homedemandindex.com
This is Tooltip!
Washington D.C. | May 2021
Townhouse/Rowhouse/Twin All prices
Townhouse/ Rowhouse/Twin All prices
Demand for townhouses rose moderately in April to a reading of 147, reflecting a High level of buyer interest. Like other segments of the market, demand has been on a solid upward trend through the early months of 2021. The month’s supply of homes for sale was just 0.8 suggesting a relatively rapid pace of sales with townhouses remaining on the market for only a few days in some cases.
Monthly Statistics for Townhouse/Rowhouse/TwinAll prices
Home Demand Index
147
(High)
Home Demand Index from prior month
136
Home Demand Index from prior year
98
Months of Inventory
0.8
Average daily inventory last month
1,396
Inventory sold last month
1,727
Bright MLS | T3 Home Demand Index
www.homedemandindex.com
Note
1. This report is generated with data from the following counties: Alexandria City, VA; Arlington, VA; Fairfax City, VA; Fairfax, VA; Falls Church City, VA; Montgomery, MD; Prince Georges, MD; Washington, DC
2. This report is for the May 2021 period with data collected from the previous month.
Released: May 11, 2021
Reference ID: 1177
Washington D.C. | May 2021
Home Demand Map (Zip Codes)
Two-thirds of ZIP codes in the Washington market area recorded an Index reading in the High category, up slightly from March. Demand in an additional 14 percent of communities was in the Moderate category. The few areas of Steady, Slow or Limited demand were scattered throughout the market area.
Bright MLS | T3 Home Demand Index
www.homedemandindex.com
Embed the Timeline
To embed the map on your website, copy and paste the code below. Please note that the ideal dimensions for displaying the map are 1312 pixels wide by 660 pixels high.
Embed the Map
To embed the map on your website, copy and paste the code below. Please note that the ideal dimensions for displaying the map are 1312 pixels wide by 1182 pixels high.
Embed the Housing Type Bar Chart
To embed the map on your website, copy and paste the code below. Please note that the ideal dimensions for displaying the map are 1312 pixels wide by 880 pixels high.