Buyer demand for homes in the Washington MLS market area declined by seven percent based on the Bright MLS | T3 Home Demand Index. The Index, at 147, remained in the High category despite the decline over the month. Compared to one year earlier, the Index was 20 percent higher suggesting that demand for homes in the area remained strong.
Buyer demand was High among all types of homes except lower-priced single-family where demand was Slow. Buyer interest in each market segment softened in May, however. Consistent with the past several months, demand was strongest for single-family homes priced above $950,000 and higher-priced condos. The inventory of homes for sale remained low, ranging from just a 0.7 months supply for mid-priced single-family homes to a 2.7 months supply for higher-priced condos. The month’s supply for each type of home was little changed compared with April.
Monthly Statistics for June 2021
Home Demand Index
147
(High)
Home Demand Index from prior month
158
Home Demand Index from prior year
122
Index change from prior month
-7%
Index change from same time last year
20.5%
Bright MLS | T3 Home Demand Index
www.homedemandindex.com
Download tile as an image.
Embed this tile on your site.
Washington D.C. | June 2021
Home Demand Index | Historical Year-over-Year Comparison
Buyer interest has been on a generally upward trend through the early months of the year. Since the December seasonal low, the Index has risen by 62 percent. In fact, the Index has been in the High category for the past three months. Furthermore, demand has been higher than the same period one year earlier for at least the past twelve months due, in part, to low mortgage interest rates and a strengthening local economy.
Home Demand Index
Bright MLS | T3 Home Demand Index
www.homedemandindex.com
Download the top-level Market Areas map as a screenshot.
Embed this tile on your site.
Washington D.C. | June 2021
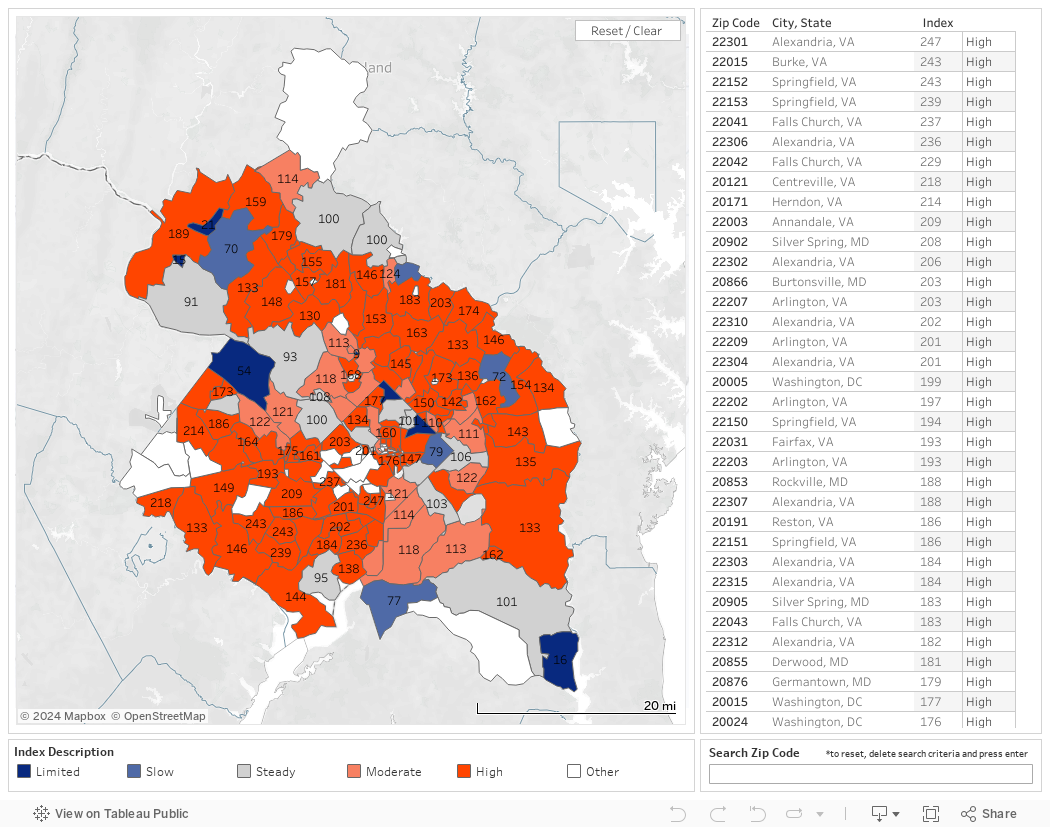
Home Demand Map
Two-thirds of ZIP codes in the Washington market area recorded an Index reading in the High category in May, essentially unchanged from the previous month. Just six percent of ZIP codes were in the Slow or Limited category, about half as many as the month before.
Bright MLS | T3 Home Demand Index
www.homedemandindex.com
Download tile as an image.
Embed this tile on your site.
Washington D.C. | June 2021
Demand and Inventory by Home Type
Buyer demand was High among all types of homes except lower-priced single-family where demand was Slow. Buyer interest in each market segment softened in May, however. Consistent with the past several months, demand was strongest for single-family homes priced above $950,000 and higher-priced condos. The inventory of homes for sale remained low, ranging from just a 0.7 months supply for mid-priced single-family homes to a 2.7 months supply for higher-priced condos. The month’s supply for each type of home was little changed compared with April.
Bright MLS | T3 Home Demand Index
www.homedemandindex.com
Download tile as an image.
Washington D.C. | June 2021
Single Family Home Below $395k
The Bright MLS | T3 Home Demand Index for lower-priced single-family homes fell to 73 in May. The Index also was lower than one year earlier, despite the disruptions to homebuying activity in the early stages of the pandemic last year. Consistent with other segments of the market, the supply of homes available for sale at this price point remained very low with an average daily inventory of just 341 homes, equivalent to a 1.2 months supply, for the entire Washington market area.
Monthly Statistics for Single Family Home Below $395k
Home Demand Index
73
(Slow)
Home Demand Index from prior month
78
Home Demand Index from prior year
102
Months of inventory
1.2
Average daily inventory last month
341
Inventory sold last month
286
Bright MLS | T3 Home Demand Index
www.homedemandindex.com
Download tile as an image.
Washington D.C. | June 2021
Single Family Home $395k - $950k
Buyer interest in mid-price single-family homes remained elevated in May. Although the Index fell over the month, it was well above the threshold for High buyer demand. The months supply of homes available for sale continued to be extraordinarily low at just 0.7 and little changed from the levels of the past several months. Would-be home buyers continued to snap up homes, in some instances, after just a few days on the market.
Monthly Statistics for Single Family Home $395k - $950k
Home Demand Index
163
(High)
Home Demand Index from prior month
174
Home Demand Index from prior year
132
Months of Inventory
0.7
Average daily inventory last month
1,231
Inventory sold last month
1,688
Bright MLS | T3 Home Demand Index
www.homedemandindex.com
Download tile as an image.
Washington D.C. | June 2021
Single Family Home Above $950k
The Bright MLS | T3 Home Demand Index for single-family homes priced above $950,000 was 243 in May, a modest decline from the previous month but still reflecting a strong level of buyer demand. During the past several months, buyer interest in homes at this price point has been consistently higher than other lower-priced single-family segments likely due to several factors including favorable mortgage financing rates and a strengthening economy, which has tended to favor higher-income households. The months supply of homes on the market, at 1.3, was unchanged from the previous month.
Monthly Statistics for Single Family Home Above $950k
Home Demand Index
243
(High)
Home Demand Index from prior month
264
Home Demand Index from prior year
155
Months of Inventory
1.3
Average daily inventory last month
796
Inventory sold last month
625
Bright MLS | T3 Home Demand Index
www.homedemandindex.com
Download tile as an image.
Washington D.C. | June 2021
Condo Below $570k
Demand for lower-priced condos fell marginally in May with an Index reading of 165. Despite the decline over the month, buyer interest remained in the High category, consistent with the pattern of the past several months. Inventory conditions, although still challenging for many buyers, eased in May, with a months supply of 2.3, up from two months in April.
Monthly Statistics for Condo Below $570k
Home Demand Index
165
(High)
Home Demand Index from prior month
176
Home Demand Index from prior year
112
Months of Inventory
2.3
Average daily inventory last month
2,375
Inventory sold last month
1,021
Bright MLS | T3 Home Demand Index
www.homedemandindex.com
This is Tooltip!
Washington D.C. | June 2021
Condo Above $570k
Demand for higher-priced condos eased in May with the Index falling 14 percent to a reading of 190, but still reflecting a High level of buyer interest. The months supply of homes available for sale rose to 2.7 from 2.4 in April. During the past several months, this segment has had somewhat more favorable inventory conditions for buyers, although it accounts for only about four percent of sales across the Washington market area.
Monthly Statistics for Condo Above $570k
Home Demand Index
190
(High)
Home Demand Index from prior month
222
Home Demand Index from prior year
121
Months of Inventory
2.7
Average daily inventory last month
537
Inventory sold last month
202
Bright MLS | T3 Home Demand Index
www.homedemandindex.com
This is Tooltip!
Washington D.C. | June 2021
Townhouse/Rowhouse/Twin All prices
Townhouse/ Rowhouse/Twin All prices
The Bright MLS | T3 Home Demand Index for the townhouse segment fell slightly to 139, a reading that still indicated a High level of buyer interest. The inventory of townhouses available for sale has risen in each of the past three months resulting in a slight improvement in the balance between buyer demand and the number of townhouses available for sale. The months supply was 0.9 in May, up from 0.8 in both March and April.
Monthly Statistics for Townhouse/Rowhouse/TwinAll prices
Home Demand Index
139
(High)
Home Demand Index from prior month
147
Home Demand Index from prior year
120
Months of Inventory
0.9
Average daily inventory last month
1,583
Inventory sold last month
1,790
Bright MLS | T3 Home Demand Index
www.homedemandindex.com
Note
1. This report is generated with data from the following counties: Alexandria City, VA; Arlington, VA; Fairfax City, VA; Fairfax, VA; Falls Church City, VA; Montgomery, MD; Prince Georges, MD; Washington, DC
2. This report is for the June 2021 period with data collected from the previous month.
Released: June 10, 2021
Reference ID: 1276
Washington D.C. | June 2021
Home Demand Map (Zip Codes)
Two-thirds of ZIP codes in the Washington market area recorded an Index reading in the High category in May, essentially unchanged from the previous month. Just six percent of ZIP codes were in the Slow or Limited category, about half as many as the month before.
Bright MLS | T3 Home Demand Index
www.homedemandindex.com
Embed the Timeline
To embed the map on your website, copy and paste the code below. Please note that the ideal dimensions for displaying the map are 1312 pixels wide by 660 pixels high.
Embed the Map
To embed the map on your website, copy and paste the code below. Please note that the ideal dimensions for displaying the map are 1312 pixels wide by 1182 pixels high.
Embed the Housing Type Bar Chart
To embed the map on your website, copy and paste the code below. Please note that the ideal dimensions for displaying the map are 1312 pixels wide by 880 pixels high.