The Bright MLS | T3 Home Demand Index (HDI) is an index that is designed to track the level of interest of actively engaged home buyers in local markets. The HDI does not track home prices or the number of sales directly. Instead, it measures activities before a sale transaction and is a leading indicator of market activity.
Each type of home is segmented to capture different common price points and housing types. Cluster analysis is used to identify the prevalent price ranges for each type of home within each geographic area.
The Bright MLS | T3 Home Demand Index scores the activity level of each market based on a comparison to the baseline period for the market in 2019. The index has five levels of ratings:
| Activity | HDI Range | Description |
|---|---|---|
| High | 130 and above | High demand with lots of consumer pre-sales activity |
| Moderate | 110 to 130 | Activity showing consistently strong buyer interest. |
| Steady | 90 to 110 | Steady activity means the activity is substantially the same as the baseline period in 2019. |
| Slow | 70 to 90 | Activity showing consistently weak buyer activity. |
| Limited | Below 70 | Very little demand and weak buyer activity. |
The Bright MLS |T3 Home Demand Index currently covers the three greater metropolitan market areas, served by Bright MLS, namely the Greater Philadelphia Area, the Greater Washington D.C. Area, and the Greater Baltimore Area. Smaller, more local regions are available for a deeper dive within the map for each market area.
These market areas are determined by Bright MLS and are based on the natural real estate markets that occur in these geographies. These areas are referred to as MLS Market Areas (MMA). The main market areas in the Bright MLS | T3 Home Demand Index are defined by counties and are reflected in the list below.
Greater Philadelphia Area
- Central Pennsylvania – Adams, PA; Berks, PA; Cumberland, PA; Dauphin, PA; Franklin, PA; Fulton, PA; Lancaster, PA; Lebanon, PA; Perry, PA; Schuylkill, PA; York, PA.
- Ocean County – Ocean, NJ.
- Philadelphia Metro – Bucks, PA; Burlington, NJ; Camden, NJ; Chester, PA; Delaware, PA; Gloucester, NJ; Kent, DE; Mercer, NJ; Montgomery, PA; New Castle, DE; Philadelphia, PA.
- Salem-Cumberland – Cumberland, NJ; Salem, NJ.
Greater Baltimore Area
- Baltimore Metro – Anne Arundel, MD; Baltimore City, MD; Baltimore, MD; Carroll, MD; Harford, MD; Howard, MD.
- DelMar Coastal – Somerset, MD; Sussex, DE; Wicomico, MD; Worcester, MD.
- Maryland Eastern Shore – Caroline, MD; Cecil, MD; Dorchester, MD; Kent, MD; Queen Annes, MD; Talbot, MD.
Greater Washington DC Area
- Maryland-West Virginia Panhandle – Allegany, MD; Berkeley, WV; Garrett, MD; Grant, WV; Hampshire, WV; Hardy, WV; Jefferson, WV; Mineral, WV; Morgan, WV; Pendleton, WV; Washington, MD.
- North Central Virginia – Caroline, VA; Clarke, VA; Culpeper, VA; Fauquier, VA; Frederick, VA; Fredericksburg City, VA; King George, VA; Madison, VA; Manassas City, VA; Orange, VA; Page, VA; Prince William, VA; Rappahannock, VA; Shenandoah, VA; Spotsylvania, VA; Stafford, VA; Warren, VA; Winchester City, VA.
- Southern Maryland – Calvert, MD; Charles, MD; Saint Marys, MD.
- Washington D.C. Metro – Alexandria City, VA; Arlington, VA; Fairfax, VA; Falls Church City, VA; Frederick, MD; Loudoun, VA; Montgomery, MD; Prince Georges, MD; Washington, DC.
Data used in the Bright MLS | T3 Home Demand Index are sourced from the Bright MLS and, depending on availability in a particular area, include the following:
-
Viewing activity of agents and consumers working with agents using the MLS system.
-
Agent/Consumer showing appointment reservations.
- MLS listing and home sales
Rural and other areas with very few listings may not have enough data to calculate an index. An example would be a rural ZIP code with one property available and adding a second property in the next month. The index would not be calculated for the ZIP due to a lack of data instead of trying to represent the doubling of activity.
The Bright MLS | T3 Home Demand Index utilizes a patent-pending algorithm that combines an array of source data, including pre-sale activity indicators such as showings per listing and views per listing. Each of the components is weighted based on an analysis of past trends in home sales and correlations with housing market activity for the specific market. The Index scores are then aligned with a base period set to a value of 100. The index calculation is periodically revised to improve the Bright MLS | T3 Home Demand Index and makes use of a number of machine learning and statistical methods to improve accuracy and relevancy between pre-sale consumer and real estate professional activities and actual sales transactions.
For each metro area (Philadelphia, Baltimore, and Washington DC), the baseline index is set to 100 and is based on market activity in 2019. Future market activity is compared against the 2019 baseline.
The following chart describes how the baseline affects how you interpret the HDI within a market area using a simplified example:
| Activity | Metro A | Metro B |
|---|---|---|
| Pre-sale Activities in December 2019 | 15,000 | 25,000 |
| Baseline based on 2019 Activity | 100 | 100 |
| Pre-sale Activities in December 2022 | 15,200 | 24,800 |
| HDI in December 2022 | 102 | 99 |
When calculating the December 2022 HDI for Metro B (bottom right), the HDI of 99 is relative to that metro area’s 2019 baseline. The HDI can be used to compare market activity over time for a metro area or across local geographies within a metro area. However, the HDI is currently not set up to allow for comparisons of market activity across metro areas.
The index provides a measure of the overall competitiveness of a local market. For each geography (e.g., county, zip code), the index is compared to a baseline of 100, reflecting market conditions in the metropolitan area in 2019. An HDI of 125, for example, means that pre-sales activity in a local market is 25 points higher than the baseline activity level. Higher index values reflect more buyer interest than in the base period of 2019 and suggest that the local housing market is relatively more competitive than in 2019. Conversely, an index score of 90 indicates a weaker pre-sales activity than during 2019.
County-to-County Comparisons
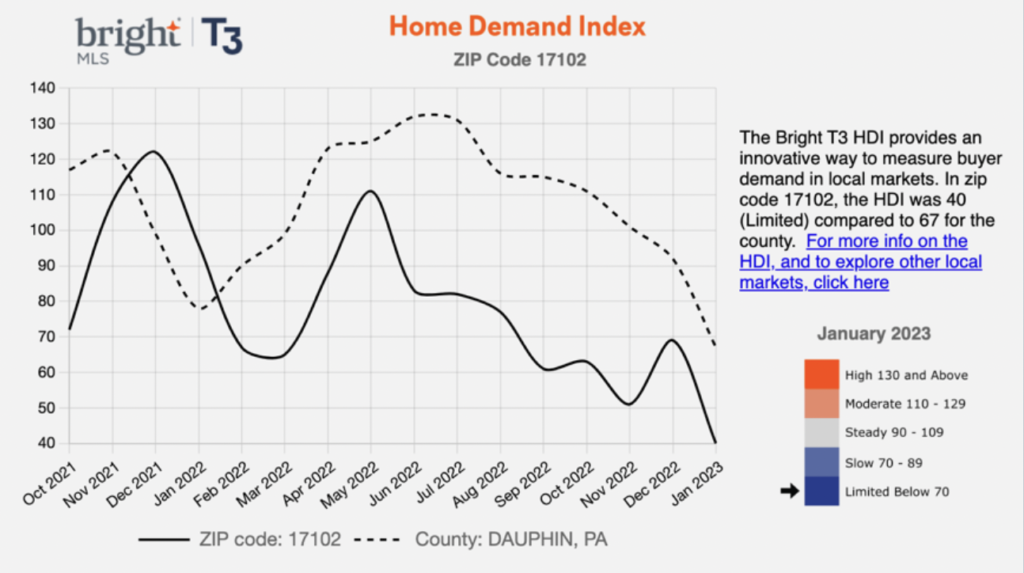
The following two charts compare Harrisburg, PA (Dauphine County) in the first chart and Reading, PA (Berks County) in the second.
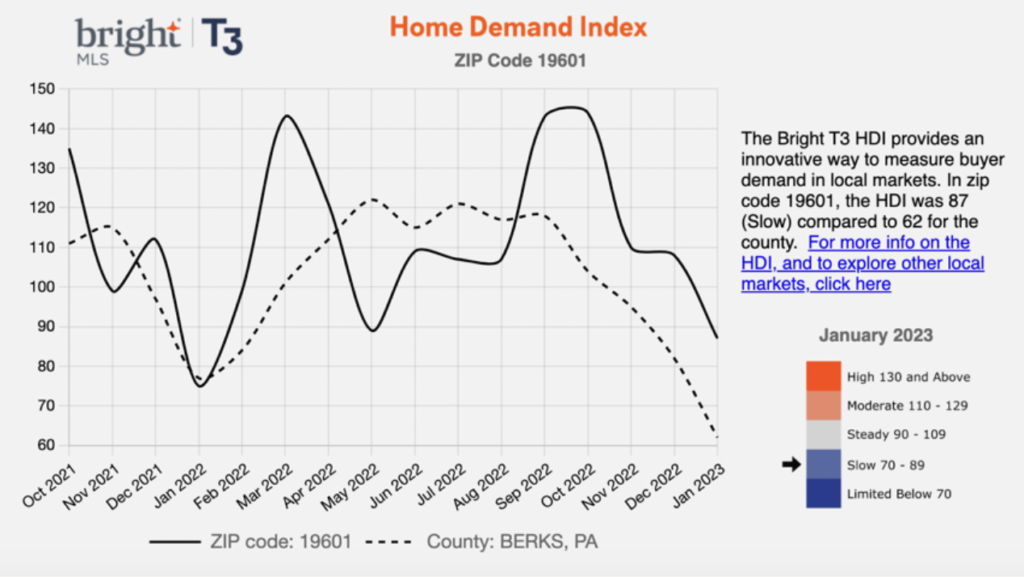
Since both counties are within the same market area, they can be directly compared with 77 for Dauphin and 62 for Berks. It would be best if you did not compare counties in different metro areas, such as Dauphine County, PA, and Calvert County, MD.
ZIP-to-ZIP Comparisons
The following two charts compare Harrisburg, PA (ZIP 17102) in the first chart and Hersey, PA (ZIP 17033) in the second chart.
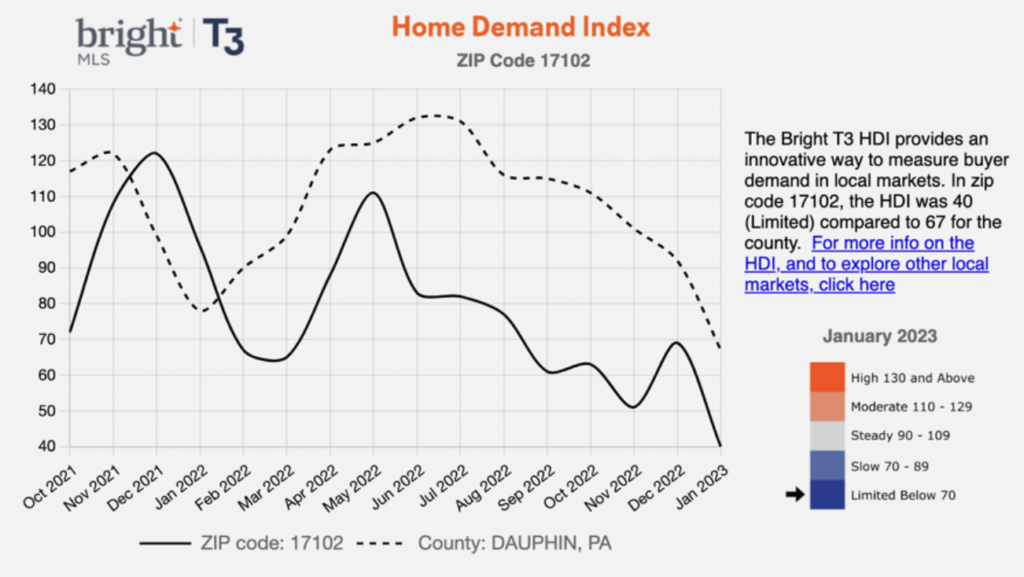
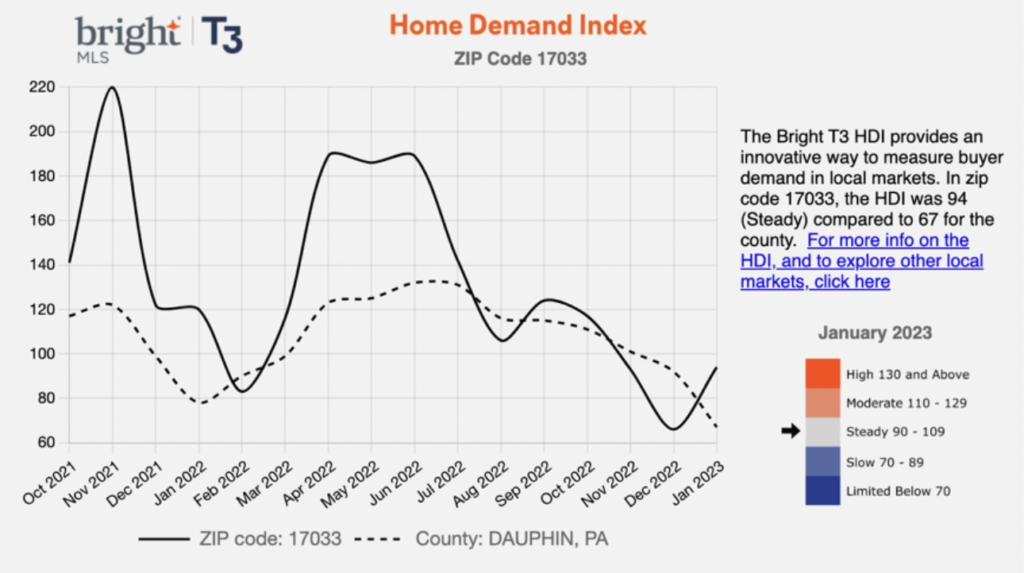
Since both ZIP codes are in the same metro area, these zip codes can be compared safely. It would be best if you did not compare ZIP codes in different metro areas, such as 17102 in the Philadelphia metro and
20117 in the Washington, DC metro.
The Bright | T3 Home Demand Index website includes interactive maps, as well as tables and charts displaying 24 months of data.
NOTE: An Application Programming Interface (API) is available to download historical information for Zip codes and counties. Using the API to download requires members to write code. A separate widget, similar in structure to the embedded HDI, could be developed to facilitate history for use anywhere within the Bright web footprint. Another option would be to add a history button on the existing embedded HDI.
The Bright T3 Home Demand Index is published monthly and is released with the monthly market report from Bright MLS.
Many indexes measure sales activity after the sale occurs, and as such, reflects how the market *was* weeks or months ago. The Bright T3 Home Demand Index measures home buying demand activities before actual sales transactions occur. The Bright T3 Home Demand Index is also calculated at more localized levels as well as fine-tuned to the different types of homes, so it provides a more accurate view of home demand than other real estate indexes.
The index can be used in several ways. First, it provides a reading on the level of consumer home buying interest across several residential segments. Second, the index allows the user to compare the latest data with information from a year earlier and spot trends. Finally, the index can be used to make comparisons across geographic areas and uncover trends at the metropolitan, county or ZIP code levels. The Home Demand Index provides brokers and agents a new way to determine current home buying demand in a region and is a significantly more dynamic, localized and real-time method than using pending or sold data.
The Bright T3 Home Demand index allows real estate professionals and consumers to track market activity for different types of homes. Price thresholds are used further break down some of the types.
Single-family detached homes
- Entry-level
- Mid-Market
- Luxury
Townhouse/Twin
Condominiums
- Entry-level
- Luxury
The entry-level, mid-market, and luxury categories are based on an analysis of the prices of homes sold over the prior 12 months within the metro area. Every metro area has different thresholds calculated each month to account for property valuation increases over time. For example, for January 2023, the following thresholds were used:
| Housing Type | Baltimore | Philadelphia | Washington DC |
|---|---|---|---|
| Single-family Entry | Below $250K | Below $195K | Below $395K |
| Single-family Mid | $250K-$590K | $195K-$495K | $395K-$950K |
| Single-family Luxury | Above $590K | Above $485K | Above $950k |
| Townhouse/Twin | N/A | N/A | N/A |
| Condo Entry | Below $310k | Below $360k | Below $570k |
| Condo Luxury | Above $310k | Above $360k | Above $570k |
Each month, the thresholds are recalculated based on the past 12 months of actual data. You should note this if you compare housing types over history because what is considered and Single-Family Entry-level can change over time. The thresholds are set to ensure that all homes in a category are still considered an entry, mid, or luxury, depending based on cluster analysis.