Buyer demand for homes in the Washington MLS market area in March was High according to the Bright MLS | T3 Home Demand Index. The Index, at 144, was 23 percent higher than the February reading and markedly higher than one year earlier.
The rising level of buyer interest in Washington area homes in March was reflected among each type of home tracked by the Index. Buyer interest in lower-priced single-family homes was Slow, although rising marginally from the previous month. Among all other segments, the Index was in the High category and rose by double-digit percentages over the month. The inventory of homes available for sale remained remarkably low ranging from a 0.7 months supply for mid-priced single-family homes to a barely adequate 2.9 months supply for higher-priced condos.
Monthly Statistics for April 2021
Home Demand Index
144
(High)
Home Demand Index from prior month
117
Home Demand Index from prior year
117
Index change from prior month
23.1%
Index change from same time last year
23.1%
Bright MLS | T3 Home Demand Index
www.homedemandindex.com
Download tile as an image.
Embed this tile on your site.
Washington D.C. | April 2021
Home Demand Index | Historical Year-over-Year Comparison
The Bright MLS | T3 Home Demand Index rose for the third consecutive month and was only slightly below last year’s peak level of demand recorded in October. Demand has not only risen but the gains have accelerated since December with the Index remaining above the same month one year earlier since June. The increase in demand has occurred despite rising mortgage interest rates and tight inventory conditions across the Washington region.
Home Demand Index
Bright MLS | T3 Home Demand Index
www.homedemandindex.com
Download the top-level Market Areas map as a screenshot.
Embed this tile on your site.
Washington D.C. | April 2021
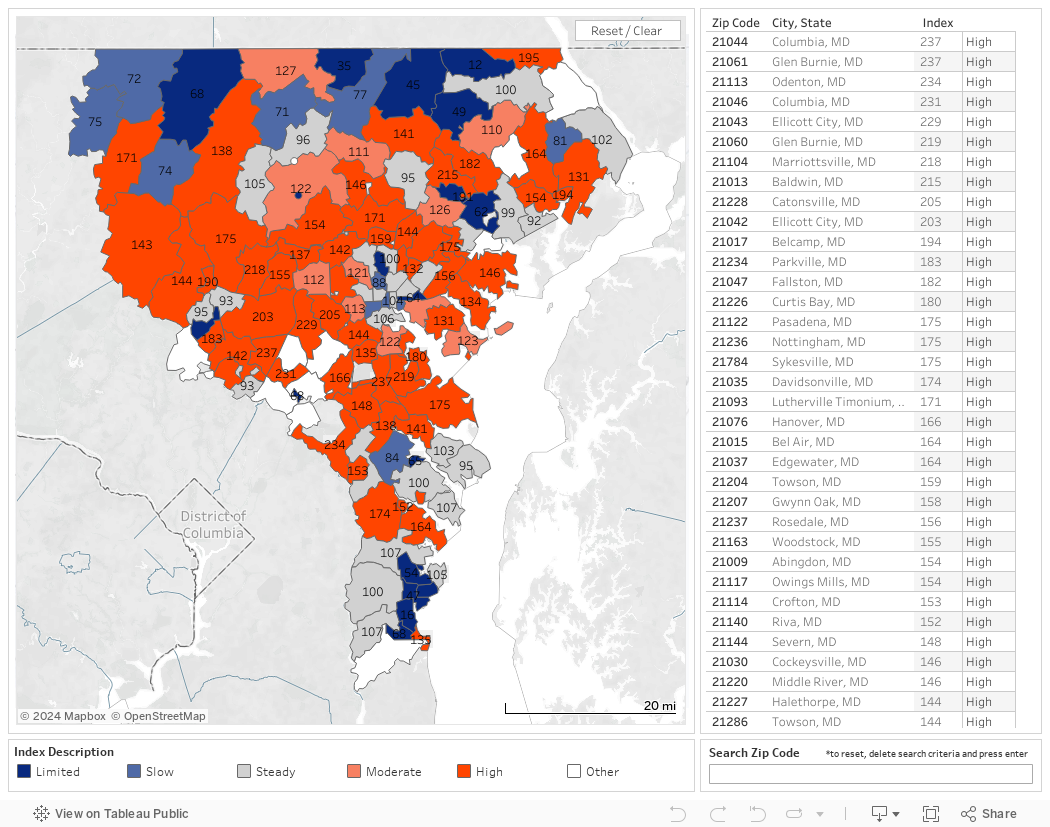
Home Demand Map
The strength of buyer demand was evident across the Washington market area in March. More than 60 percent of ZIP codes recorded an Index value in the High category compared with 40 percent the previous month. An additional 14 percent of ZIP codes were in the Moderate range of buyer demand. As a result, few areas recorded Slow or Limited buyer interest with only scattered pockets of Steady demand.
Bright MLS | T3 Home Demand Index
www.homedemandindex.com
Download tile as an image.
Embed this tile on your site.
Washington D.C. | April 2021
Demand and Inventory by Home Type
The rising level of buyer interest in Washington area homes in March was reflected among each type of home tracked by the Index. Buyer interest in lower-priced single-family homes was Slow, although rising marginally from the previous month. Among all other segments, the Index was in the High category and rose by double-digit percentages over the month. The inventory of homes available for sale remained remarkably low ranging from a 0.7 months supply for mid-priced single-family homes to a barely adequate 2.9 months supply for higher-priced condos.
Bright MLS | T3 Home Demand Index
www.homedemandindex.com
Download tile as an image.
Washington D.C. | April 2021
Single Family Home Below $395k
The Bright MLS | T3 Home Demand Index for lower-priced single-family homes rose five percent in March but remained 25 percent below the level one year earlier. Buyer interest in this segment has been Limited or Slow for the past several months even as demand for other types of homes has remained strong. Low inventory and fallout from the economic downturn curtailed buyer interest even as some properties were snapped up by investors. Compared with February, the months supply was unchanged at 1.2.
Monthly Statistics for Single Family Home Below $395k
Home Demand Index
80
(Slow)
Home Demand Index from prior month
76
Home Demand Index from prior year
106
Months of inventory
1.2
Average daily inventory last month
360
Inventory sold last month
304
Bright MLS | T3 Home Demand Index
www.homedemandindex.com
Download tile as an image.
Washington D.C. | April 2021
Single Family Home $395k - $950k
Buyer interest in mid-priced single-family homes, accounting for about one-quarter of sales transactions across the region, rose 34 percent in March and was well above the level one year earlier. The elevated level of interest has resulted in a rapid pace of sales that has drawn down already low inventory levels. In March, the months supply was only 0.7, suggesting that many homes were on the market for a matter of days and were quickly purchased.
Monthly Statistics for Single Family Home $395k - $950k
Home Demand Index
157
(High)
Home Demand Index from prior month
117
Home Demand Index from prior year
123
Months of Inventory
0.7
Average daily inventory last month
899
Inventory sold last month
1,260
Bright MLS | T3 Home Demand Index
www.homedemandindex.com
Download tile as an image.
Washington D.C. | April 2021
Single Family Home Above $950k
The Index for single-family homes priced above $950,000 was 207 in March, higher than any other type of home tracked in the Washington market area. Furthermore, the level of buyer interest rose by 42 percent, also the greatest increase among market segments. With a High level of demand, buyers searching for a home confronted tight inventory conditions. In March, the months supply was 1.3, down from two the previous month.
Monthly Statistics for Single Family Home Above $950k
Home Demand Index
207
(High)
Home Demand Index from prior month
146
Home Demand Index from prior year
137
Months of Inventory
1.3
Average daily inventory last month
587
Inventory sold last month
454
Bright MLS | T3 Home Demand Index
www.homedemandindex.com
Download tile as an image.
Washington D.C. | April 2021
Condo Below $570k
Demand for lower-priced condos has been steadily strengthening for the past three months. The Index remained in the High category with an 11 percent increase and was more than 50 percent higher than one year earlier. The inventory of condos continued a downward trend recorded during the past several months reaching a reading of two months supply in March.
Monthly Statistics for Condo Below $570k
Home Demand Index
166
(High)
Home Demand Index from prior month
149
Home Demand Index from prior year
109
Months of Inventory
2
Average daily inventory last month
2,122
Inventory sold last month
1,072
Bright MLS | T3 Home Demand Index
www.homedemandindex.com
This is Tooltip!
Washington D.C. | April 2021
Condo Above $570k
Buyer interest in higher-priced condos remained elevated in March. The Index recorded a reading of 198, up 15 percent over the month and 60 percent higher than one year earlier. While a small segment of the overall Washington market, demand for higher-priced condos has been strong for several months. Consequently, inventory conditions have become less favorable for buyers. In March, the months supply was 2.9, down from 3.9 in February.
Monthly Statistics for Condo Above $570k
Home Demand Index
198
(High)
Home Demand Index from prior month
172
Home Demand Index from prior year
123
Months of Inventory
2.9
Average daily inventory last month
507
Inventory sold last month
175
Bright MLS | T3 Home Demand Index
www.homedemandindex.com
This is Tooltip!
Washington D.C. | April 2021
Townhouse/Rowhouse/Twin All prices
Townhouse/ Rowhouse/Twin All prices
The Index for townhouses rose 20 percent to a reading of 139 reflecting a High level of demand. Accounting for one-third of sales transactions, the townhouse segment has experienced growing buyer interest during the past several months resulting in an extraordinarily low 0.8 months supply in March, a decrease from one month in February.
Monthly Statistics for Townhouse/Rowhouse/TwinAll prices
Home Demand Index
136
(High)
Home Demand Index from prior month
113
Home Demand Index from prior year
115
Months of Inventory
0.8
Average daily inventory last month
1,309
Inventory sold last month
1,549
Bright MLS | T3 Home Demand Index
www.homedemandindex.com
Note
1. This report is generated with data from the following counties: Alexandria City, VA; Arlington, VA; Fairfax City, VA; Fairfax, VA; Falls Church City, VA; Montgomery, MD; Prince Georges, MD; Washington, DC
2. This report is for the April 2021 period with data collected from the previous month.
Released: April 12, 2021
Reference ID: 1161
Washington D.C. | April 2021
Home Demand Map (Zip Codes)
The strength of buyer demand was evident across the Washington market area in March. More than 60 percent of ZIP codes recorded an Index value in the High category compared with 40 percent the previous month. An additional 14 percent of ZIP codes were in the Moderate range of buyer demand. As a result, few areas recorded Slow or Limited buyer interest with only scattered pockets of Steady demand.
Bright MLS | T3 Home Demand Index
www.homedemandindex.com
Embed the Timeline
To embed the map on your website, copy and paste the code below. Please note that the ideal dimensions for displaying the map are 1312 pixels wide by 660 pixels high.
Embed the Map
To embed the map on your website, copy and paste the code below. Please note that the ideal dimensions for displaying the map are 1312 pixels wide by 1182 pixels high.
Embed the Housing Type Bar Chart
To embed the map on your website, copy and paste the code below. Please note that the ideal dimensions for displaying the map are 1312 pixels wide by 880 pixels high.