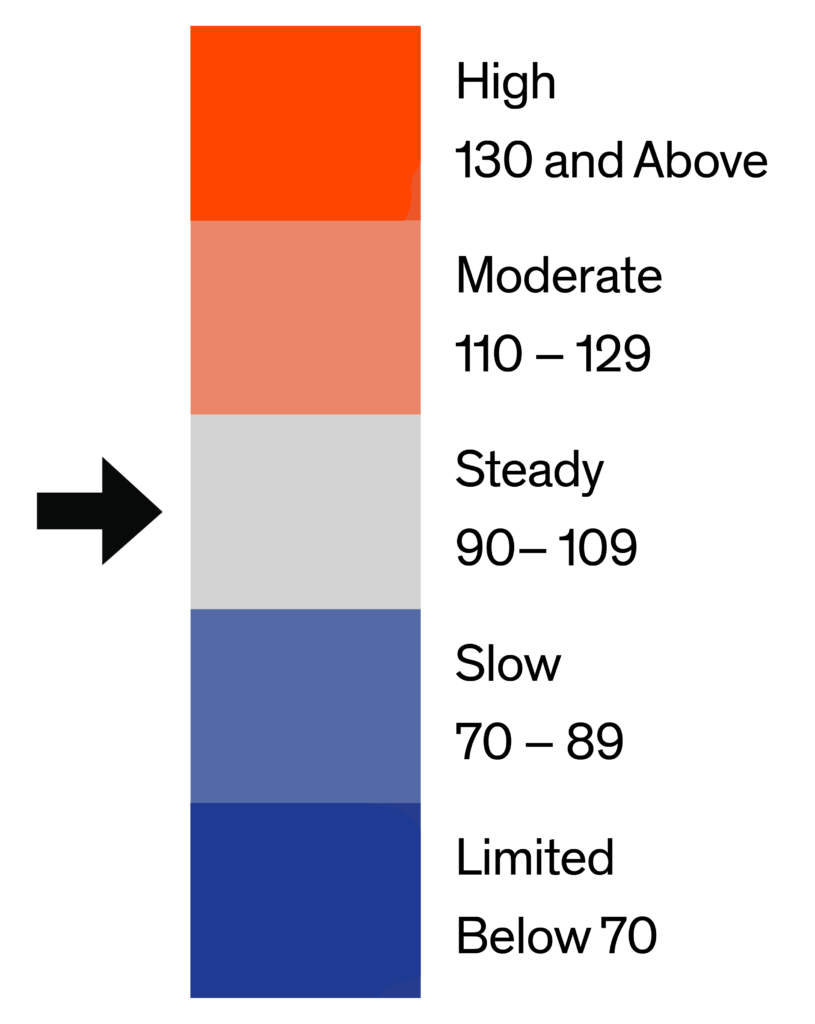
The Bright MLS | T3 Home Demand Index for the Washington MLS market area was at 91 in December reflecting a Steady level of buyer interest. While the Index fell 16 percent during the month, demand was 42 percent higher than one year earlier. Still, would-be buyers were challenged in their search for a home by an exceptionally low number of homes available for sales even as mortgage interest rates remained attractive.
Based on the latest reading from the Bright MLS | T3 Home Demand Index, buyer interest in all types of homes was softer in December. While the decrease is consistent with the usual seasonal pattern of buyer activity, all segments, except the lowest-priced single-family segment, recorded a level of buyer interest that was still higher than one year earlier. Tight inventory conditions were consistently present among all segments, posing a challenge for buyers at all price points.
Monthly Statistics for January 2021
Home Demand Index
91
(Steady)
Home Demand Index from prior month
108
Home Demand Index from prior year
64
Index change from prior month
-15.7%
Index change from same time last year
42.2%
Bright MLS | T3 Home Demand Index
www.homedemandindex.com
Download tile as an image.
Embed this tile on your site.
Washington D.C. | January 2021
Home Demand Index | Historical Year-over-Year Comparison
Home demand in the Washington market area was significantly stronger during the second half of 2020 compared with the same period in 2019. Pent-up demand from spring market disruptions due to the Covid-19 pandemic and a favorable mortgage financing environment spurred would-be buyers to intensify their search and purchase activity throughout the rest of 2020. Since reaching a peak reading in October, the Bright MLS | T3 Home Demand Index has decreased in line with the expected seasonal pattern of lower buyer interest at the end of the year.
Home Demand Index
Bright MLS | T3 Home Demand Index
www.homedemandindex.com
Download the top-level Market Areas map as a screenshot.
Embed this tile on your site.
Washington D.C. | January 2021
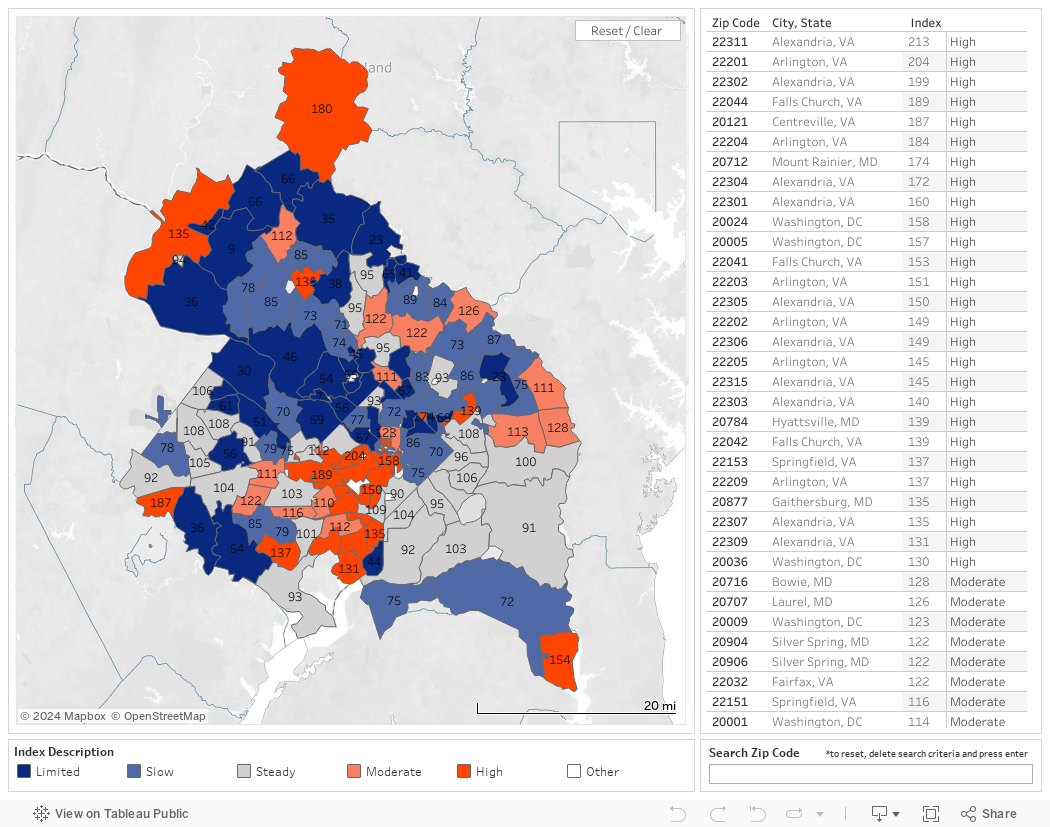
Home Demand Map
The Bright MLS | T3 Home Demand Index revealed concentrations of strong buyer demand in the Washington market area in December. Roughly 20 percent of ZIP codes recorded an Index in the High category, with most concentrated in Arlington and Fairfax counties. Nearby areas logged an Index score in the Steady category. Half of the ZIP codes, however, were in the Slow or Limited category, a majority of which were in the northern portion of the market area.
Bright MLS | T3 Home Demand Index
www.homedemandindex.com
Download tile as an image.
Embed this tile on your site.
Washington D.C. | January 2021
Demand and Inventory by Home Type
Based on the latest reading from the Bright MLS | T3 Home Demand Index, buyer interest in all types of homes was softer in December. While the decrease is consistent with the usual seasonal pattern of buyer activity, all segments, except the lowest-priced single-family segment, recorded a level of buyer interest that was still higher than one year earlier. Tight inventory conditions were consistently present among all segments, posing a challenge for buyers at all price points.
Bright MLS | T3 Home Demand Index
www.homedemandindex.com
Download tile as an image.
Washington D.C. | January 2021
Single Family Home Below $395k
Buyer interest in single-family homes priced below $395,000 was Limited in December as the Index fell by 19 percent to a reading of 68. Unlike other segments of the market, buyer interest softened over several months in 2020 and remained below the year-earlier level. Even with reduced buyer interest, the small supply of homes on the market sold quickly. The inventory of homes available for sale was equal to a one-month supply at the current sales pace.
Monthly Statistics for Single Family Home Below $395k
Home Demand Index
68
(Limited)
Home Demand Index from prior month
84
Home Demand Index from prior year
84
Months of inventory
1
Average daily inventory last month
489
Inventory sold last month
501
Bright MLS | T3 Home Demand Index
www.homedemandindex.com
Download tile as an image.
Washington D.C. | January 2021
Single Family Home $395k - $950k
The Bright MLS | T3 Home Demand Index for single-family homes priced between $395,000 and $950,000 fell 20 percent in December to a level reflecting a Slow pace of buyer interest. Although decreasing over the month, the Index was 40 percent higher compared with the same period one year earlier. Homebuyer interest was driven by an urgency to lock-in favorable mortgage rates in a market with a rapid turnover of inventory. The months supply of homes available for sale in December was just 0.7.
Monthly Statistics for Single Family Home $395k - $950k
Home Demand Index
81
(Slow)
Home Demand Index from prior month
101
Home Demand Index from prior year
58
Months of Inventory
0.7
Average daily inventory last month
1,044
Inventory sold last month
1,425
Bright MLS | T3 Home Demand Index
www.homedemandindex.com
Download tile as an image.
Washington D.C. | January 2021
Single Family Home Above $950k
Buyer interest in single-family homes in the top price tier softened in December, with the Index declining by 22 percent to a Steady level of demand. Buyer interest remained significantly stronger than one year earlier, however, despite tight inventory conditions as reflected in a supply of homes for sale of only 1.6 months.
Monthly Statistics for Single Family Home Above $950k
Home Demand Index
91
(Steady)
Home Demand Index from prior month
117
Home Demand Index from prior year
46
Months of Inventory
1.6
Average daily inventory last month
679
Inventory sold last month
412
Bright MLS | T3 Home Demand Index
www.homedemandindex.com
Download tile as an image.
Washington D.C. | January 2021
Condo Below $570k
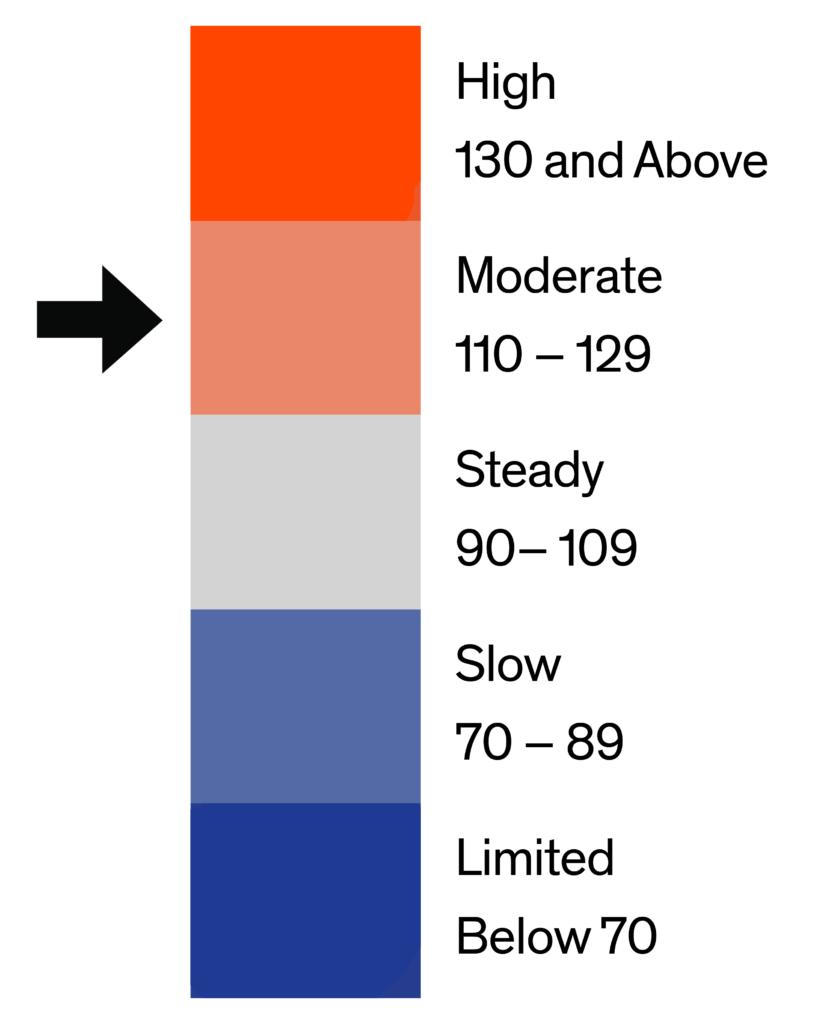
The Bright MLS | T3 Home Demand Index for lower-priced condos decreased in December to 115, a reading in the Moderate range. With very tight inventory conditions in similarly priced segments of the single-family market, buyer interest in condos remained significantly elevated compared to one year earlier. Inventory in this segment was lean at 2.2 months, but still more favorable than most other parts of the market.
Monthly Statistics for Condo Below $570k
Home Demand Index
115
(Moderate)
Home Demand Index from prior month
131
Home Demand Index from prior year
64
Months of Inventory
2.2
Average daily inventory last month
2,317
Inventory sold last month
1,069
Bright MLS | T3 Home Demand Index
www.homedemandindex.com
This is Tooltip!
Washington D.C. | January 2021
Condo Above $570k
Demand for the priciest condos was Moderate in December with an Index reading of 118. Although buyer interest decreased in December, it remained significantly elevated compared to one year earlier. Inventory conditions were more favorable than other segments of the market with a three-month supply of homes available for sale.
Monthly Statistics for Condo Above $570k
Home Demand Index
118
(Moderate)
Home Demand Index from prior month
134
Home Demand Index from prior year
58
Months of Inventory
3
Average daily inventory last month
511
Inventory sold last month
172
Bright MLS | T3 Home Demand Index
www.homedemandindex.com
This is Tooltip!
Washington D.C. | January 2021
Townhouse/Rowhouse/Twin All prices
Townhouse/ Rowhouse/Twin All prices
Buyer interest in the townhouse segment eased in December, consistent with the decline in other segments of the market. The Index, with a reading of 96, reflected a Steady pace of demand, but was still significantly higher compared with the same period one year earlier. Like other segments of the market, inventory conditions posed a challenge for buyers searching for a townhouse. There was a very low one-month supply in December.
Monthly Statistics for Townhouse/Rowhouse/TwinAll prices
Home Demand Index
96
(Steady)
Home Demand Index from prior month
112
Home Demand Index from prior year
65
Months of Inventory
1
Average daily inventory last month
1,862
Inventory sold last month
1,780
Bright MLS | T3 Home Demand Index
www.homedemandindex.com
Note
1. This report is generated with data from the following counties: Alexandria City, VA; Arlington, VA; Fairfax City, VA; Fairfax, VA; Falls Church City, VA; Montgomery, MD; Prince Georges, MD; Washington, DC
2. This report is for the January 2021 period with data collected from the previous month.
Released: March 4, 2021
Reference ID: 1019
Washington D.C. | January 2021
Home Demand Map (Zip Codes)
The Bright MLS | T3 Home Demand Index revealed concentrations of strong buyer demand in the Washington market area in December. Roughly 20 percent of ZIP codes recorded an Index in the High category, with most concentrated in Arlington and Fairfax counties. Nearby areas logged an Index score in the Steady category. Half of the ZIP codes, however, were in the Slow or Limited category, a majority of which were in the northern portion of the market area.
Bright MLS | T3 Home Demand Index
www.homedemandindex.com
Embed the Timeline
To embed the map on your website, copy and paste the code below. Please note that the ideal dimensions for displaying the map are 1312 pixels wide by 660 pixels high.
Embed the Map
To embed the map on your website, copy and paste the code below. Please note that the ideal dimensions for displaying the map are 1312 pixels wide by 1182 pixels high.
Embed the Housing Type Bar Chart
To embed the map on your website, copy and paste the code below. Please note that the ideal dimensions for displaying the map are 1312 pixels wide by 880 pixels high.