Home demand in the Washington MLS market area was marginally higher in September compared with the previous month. The Bright MLS | T3 Home Demand Index was 31 percent higher than one year before, a pattern evident among most types of homes as well. Buyer interest was generally strong throughout the market area with only a few areas showing evidence of weak demand.
Among the six types of homes tracked by the Bright MLS | T3 Home Demand Index, buyer interest was High except for lower-priced single-family homes which posted a reading in the Steady category. Demand was strongest for higher-priced single-family homes and condos. Again, except for lower-priced single-family homes, the Index was markedly higher compared with one year earlier reflecting the intense level of activity in the Washington market area. Among the three single-family segments the months supply ranged from 0.9 to just 2.2, which challenged would-be buyers in their search for a home.
Monthly Statistics for October 2020
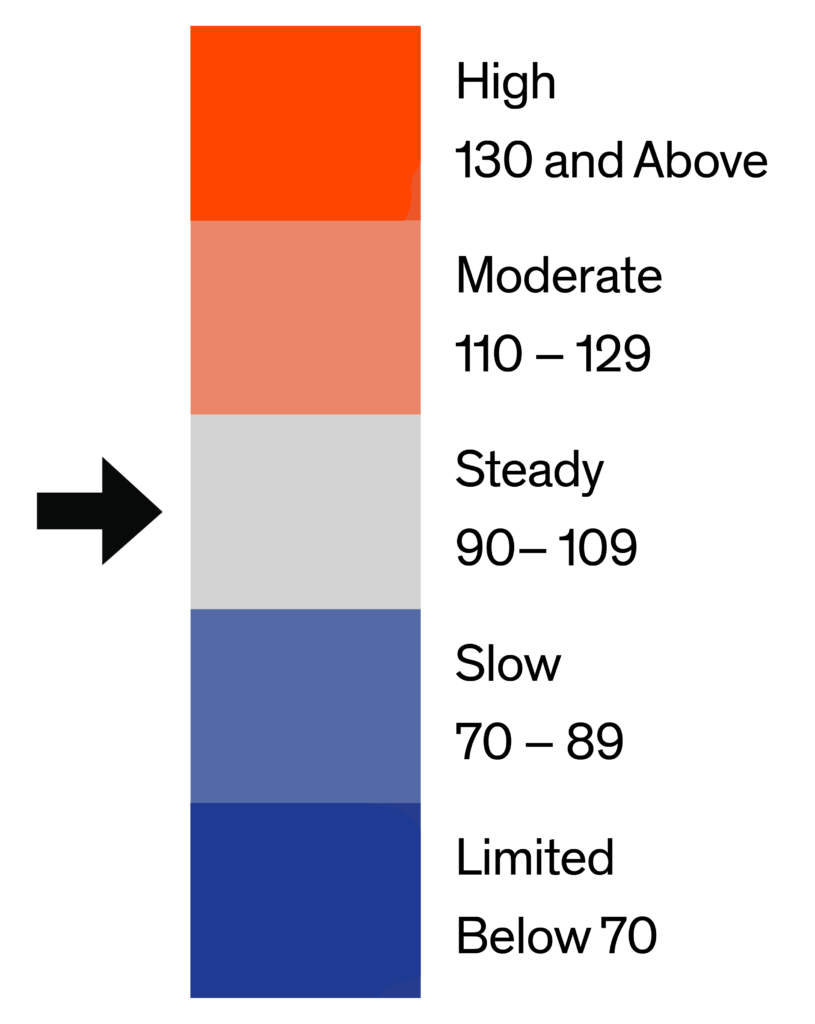
Home Demand Index
142
(High)
Home Demand Index from prior month
137
Home Demand Index from prior year
108
Index change from prior month
3.6%
Index change from same time last year
31.5%
Bright MLS | T3 Home Demand Index
www.homedemandindex.com
Download tile as an image.
Embed this tile on your site.
Washington D.C. | October 2020
Home Demand Index | Historical Year-over-Year Comparison
The September Bright MLS | T3 Home Demand Index has been above last year’s level for the past four months as buyers delayed by the Covid-19 pandemic restarted their search amid low inventories and rising home prices. Demand has been trending upward over the past 12 months and was 31 percent higher compared with one year earlier in September. The index has been above year-earlier levels for 10 of the past 12 months.
Home Demand Index
Bright MLS | T3 Home Demand Index
www.homedemandindex.com
Download the top-level Market Areas map as a screenshot.
Embed this tile on your site.
Washington D.C. | October 2020
Home Demand Map
More than half of ZIP codes in the Washington market area recorded a level of buyer interest in the High category. There were pockets of Steady demand in the southeastern portion of the market area and some areas of Limited or Slow buyer interest outside the close-in suburbs. Overall, only 13 percent of ZIP codes recorded Limited or Slow demand in September.
Bright MLS | T3 Home Demand Index
www.homedemandindex.com
Download tile as an image.
Embed this tile on your site.
Washington D.C. | October 2020
Demand and Inventory by Home Type
Among the six types of homes tracked by the Bright MLS | T3 Home Demand Index, buyer interest was High except for lower-priced single-family homes which posted a reading in the Steady category. Demand was strongest for higher-priced single-family homes and condos. Again, except for lower-priced single-family homes, the Index was markedly higher compared with one year earlier reflecting the intense level of activity in the Washington market area. Among the three single-family segments the months supply ranged from 0.9 to just 2.2, which challenged would-be buyers in their search for a home.
Bright MLS | T3 Home Demand Index
www.homedemandindex.com
Download tile as an image.
Washington D.C. | October 2020
Single Family Home Below $395k
Buyer interest in single-family homes priced below $395,000 fell in September, as reflected by a seven percent month-to-month decrease in the Bright MLS | T3 Home Demand Index. With few homes in this price range available for sale, the level of buyer interest in this segment was not only lower than other types of homes, but also has been declining. The Index was 10 percent lower in September compared to one year earlier. With average daily listings of 438 in September, about six percent of all listings, there was just a one-month supply of lower-priced single-family homes available at the current sales pace.
Monthly Statistics for Single Family Home Below $395k
Home Demand Index
94
(Steady)
Home Demand Index from prior month
101
Home Demand Index from prior year
104
Months of inventory
1
Average daily inventory last month
438
Inventory sold last month
426
Bright MLS | T3 Home Demand Index
www.homedemandindex.com
Download tile as an image.
Washington D.C. | October 2020
Single Family Home $395k - $950k
Buyer interest in mid-priced single-family homes rose in September but remained 36 percent higher than one year earlier, with an Index reading in the High category. Buyers at this price point had a challenging search with relatively few properties on the market and strong buyer interest. The months supply was just 0.9.
Monthly Statistics for Single Family Home $395k - $950k
Home Demand Index
141
(High)
Home Demand Index from prior month
137
Home Demand Index from prior year
104
Months of Inventory
0.9
Average daily inventory last month
1,415
Inventory sold last month
1,519
Bright MLS | T3 Home Demand Index
www.homedemandindex.com
Download tile as an image.
Washington D.C. | October 2020
Single Family Home Above $950k
Even at the lofty a price point of more than $950,000, buyer interest remained in the High category and 52 percent greater than the previous year. Pent-up demand from the delayed spring buying season along with low mortgage interest rates spurred many would-be buyers to intensify their search for a home. With a 2.2 months supply of homes in September, finding a home and completing a transaction was still difficult for many buyers.
Monthly Statistics for Single Family Home Above $950k
Home Demand Index
181
(High)
Home Demand Index from prior month
174
Home Demand Index from prior year
119
Months of Inventory
2.2
Average daily inventory last month
1,005
Inventory sold last month
454
Bright MLS | T3 Home Demand Index
www.homedemandindex.com
Download tile as an image.
Washington D.C. | October 2020
Condo Below $570k
Demand for lower-priced condos was High in September, rising by seven percent over the month and by 56 percent compared to a year earlier. Buyer interest is likely driven in part by the limited number of single-family homes available at price points below $570,000, making condos an option for some buyers. Inventory conditions were only slightly more favorable for condos than other similarly-priced single-family segments with a months supply of just 2.1.
Monthly Statistics for Condo Below $570k
Home Demand Index
162
(High)
Home Demand Index from prior month
151
Home Demand Index from prior year
104
Months of Inventory
2.1
Average daily inventory last month
2,002
Inventory sold last month
968
Bright MLS | T3 Home Demand Index
www.homedemandindex.com
This is Tooltip!
Washington D.C. | October 2020
Condo Above $570k
Although the smallest segment in terms of listings and sales, buyer interest in condos priced above $570,000 remained intense in September rising by 11 percent over the month and by an extraordinary 60 percent compared with one year earlier. Although not as low as other segments of the market, the months supply of 3.1 still made it difficult for buyers searching for higher-priced condos.
Monthly Statistics for Condo Above $570k
Home Demand Index
195
(High)
Home Demand Index from prior month
175
Home Demand Index from prior year
122
Months of Inventory
3.1
Average daily inventory last month
556
Inventory sold last month
182
Bright MLS | T3 Home Demand Index
www.homedemandindex.com
This is Tooltip!
Washington D.C. | October 2020
Townhouse/Rowhouse/Twin All prices
Townhouse/ Rowhouse/Twin All prices
Demand in the townhouse segment was strong, with the Bright MLS | T3 Home Demand Index posting a reading of 143, reflecting a High level of demand. Buyer interest increased from August to September and was 27 percent higher than the level one year earlier. Like most other types of homes in the Washington market area, inventory conditions were lean with a months supply of 1.1.
Monthly Statistics for Townhouse/Rowhouse/TwinAll prices
Home Demand Index
143
(High)
Home Demand Index from prior month
137
Home Demand Index from prior year
113
Months of Inventory
1.1
Average daily inventory last month
1,915
Inventory sold last month
1,666
Bright MLS | T3 Home Demand Index
www.homedemandindex.com
Note
1. This report is generated with data from the following counties: Alexandria City, VA; Arlington, VA; Fairfax City, VA; Fairfax, VA; Falls Church City, VA; Montgomery, MD; Prince Georges, MD; Washington, DC
2. This report is for the October 2020 period with data collected from the previous month.
Released: March 1, 2021
Reference ID: 1072
Washington D.C. | October 2020
Home Demand Map (Zip Codes)
More than half of ZIP codes in the Washington market area recorded a level of buyer interest in the High category. There were pockets of Steady demand in the southeastern portion of the market area and some areas of Limited or Slow buyer interest outside the close-in suburbs. Overall, only 13 percent of ZIP codes recorded Limited or Slow demand in September.
Bright MLS | T3 Home Demand Index
www.homedemandindex.com
Embed the Timeline
To embed the map on your website, copy and paste the code below. Please note that the ideal dimensions for displaying the map are 1312 pixels wide by 660 pixels high.
Embed the Map
To embed the map on your website, copy and paste the code below. Please note that the ideal dimensions for displaying the map are 1312 pixels wide by 1182 pixels high.
Embed the Housing Type Bar Chart
To embed the map on your website, copy and paste the code below. Please note that the ideal dimensions for displaying the map are 1312 pixels wide by 880 pixels high.