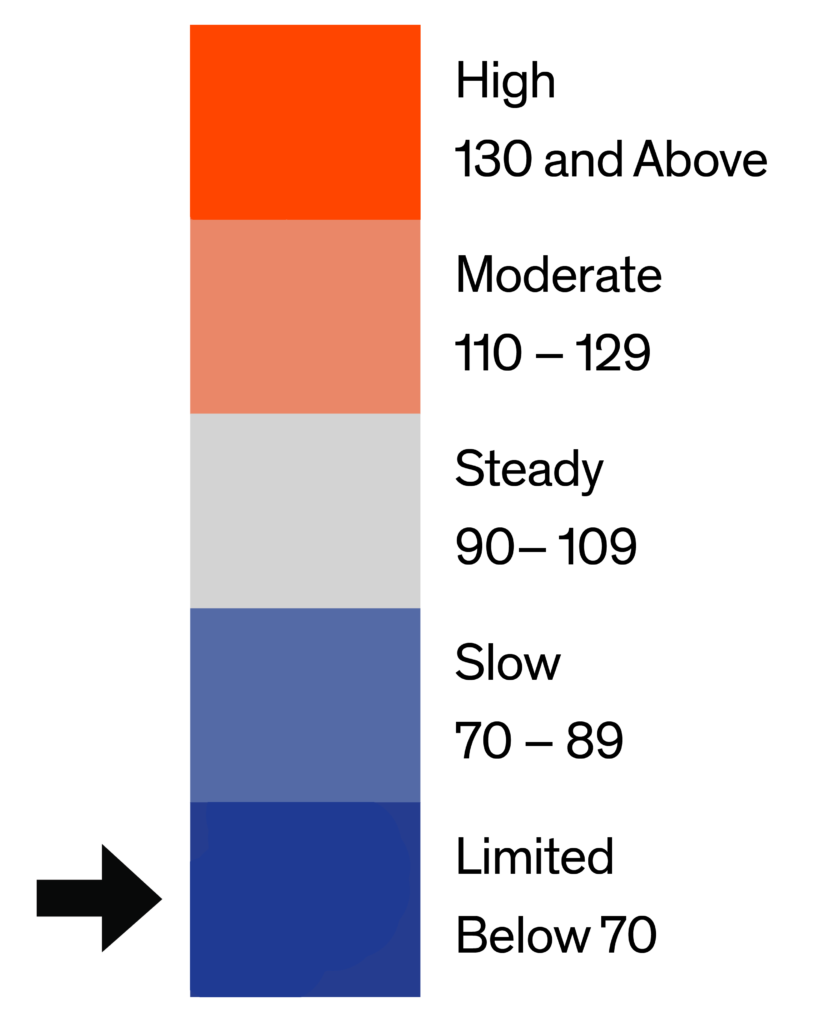
What is the Home Demand Index?

The Home Demand Index (HDI) is the nation’s only local housing market index that tracks pre-sale activity to measure housing market competitiveness. The HDI uses data on pre-sale activities, including in-person showings of homes and views of homes online, to measure housing market activity across different geographies and types of homes. The data used to construct the HDI are the most accurate and up-to-date information from the real estate agents and prospective buyers and sellers that are active in the market.

While most housing market indices are based on history, the HDI provides forward-looking insights to real estate professionals and consumers to help make better decisions in a rapidly changing real estate market
Embed this tile on your site (links update monthly).

Greater Metropolitan Market Areas

The Bright MLS |T3 Home Demand Index currently covers the three greater metropolitan market areas served by Bright MLS, namely the Greater Philadelphia Area (in blue), the Greater Washington D.C. Area (in gray), and the Greater Baltimore Area (in orange). Colors are provided for visual identification of each market area and do not correlate to index activity level. Make a selection on the map to go to the report for a market area or view an overview of each market area here..
Bright MLS | T3 Home Demand Index

www.homedemandindex.com

Washington D.C. | September 2023

Home Demand Index

The Bright MLS | T3 Home Demand Index for the Washington Metro area decreased 10.7 percent to 75, a level consistent with Slow buyer demand. The Index was 25.7 percent lower than one year earlier.
Buyer interest in all types of Washington Metro area homes was lower in August. The Index for luxury condos decreased the most, falling 19 percent to 109, but was still higher than any other segment despite the decrease over the month. Demand was weakest for entry-level and mid-market single-family homes, both in the Limited demand category. The inventory of homes for sale remained very lean with less than two months supply for all types of homes except luxury condos. The months supply ranged from 1.3 months for mid-market single-family to 2.9 months for luxury condos.
Monthly Statistics for September 2023
Home Demand
Index
75
(Slow)
Home Demand Index
from prior month
84
Home Demand Index
from prior year
101
Index change
from prior month
-10.7%
Index change from
same time last year
-25.7%
Bright MLS | T3 Home Demand Index

www.homedemandindex.com

Philadelphia | September 2023

Home Demand Index

The Bright MLS | T3 Home Demand Index for the Philadelphia Metro area fell 2.3 percent in August to 84 and remained in the Slow buyer demand category. The Index was 16.8 percent lower than one year earlier.
The Bright MLS | T3 Home Demand Index reflected generally weaker buyer activity among all types of homes in August. Demand for luxury single-family homes fell the most with a 10 percent drop in the Index. The Index for entry-level single-family homes was unchanged while demand among the remaining market segments was marginally lower. Buyer interest in luxury condos and townhouses was in the Steady category while demand for all other types of homes was in the Slow range. The months supply was lower for each type of home ranging from 1.2 months for mid-market single-family homes to 5.2 months for luxury condos.
Monthly Statistics for September 2023
Home Demand
Index
84
(Slow)
Home Demand Index
from prior month
86
Home Demand Index
from prior year
101
Index change
from prior month
-2.3%
Index change from
same time last year
-16.8%
Bright MLS | T3 Home Demand Index

www.homedemandindex.com

Baltimore | September 2023

Home Demand Index

Demand for homes in the Baltimore Metro area decreased in August according to the Bright MLS | T3 Home Demand Index. The Index, at 84, was 4.5 percent lower over the month and reflected a Slow pace of buyer activity. Compared with one year earlier, the Index was 22.2 percent lower.
Buyer interest in most types of homes fell in August. The Index for luxury single-family homes decreased the most, falling by 18 percent, followed by a 9 percent decrease for mid-market single-family homes. Demand was strongest for luxury condos, which attracted a High level of buyer interest, followed by entry-level condos with Steady demand. Demand was weakest for entry-level single-family homes with buyer interest in the Limited range. The inventory of homes available for sale remained very low in August. The months supply ranged from 1.2 months for mid-market single-family homes to 3.5 months for luxury condos.
Monthly Statistics for September 2023
Home Demand
Index
84
(Slow)
Home Demand Index
from prior month
88
Home Demand Index
from prior year
108
Index change
from prior month
-4.5%
Index change from
same time last year
-22.2%
Bright MLS | T3 Home Demand Index

www.homedemandindex.com