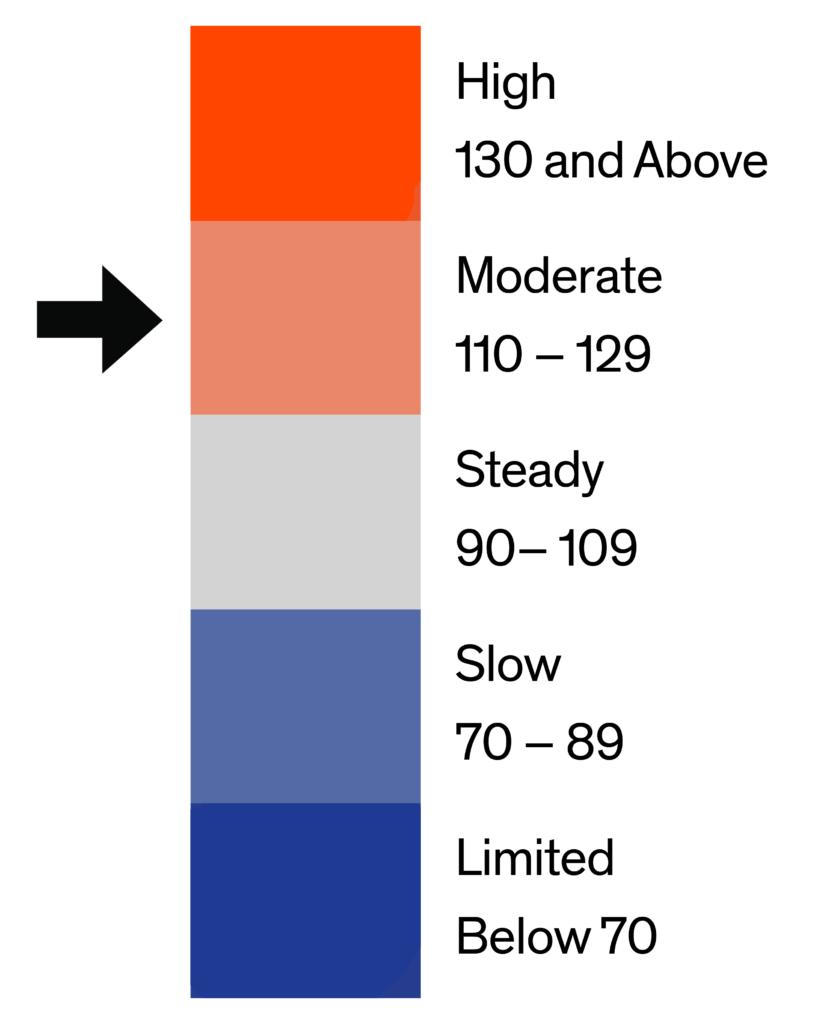
The Bright MLS | T3 Home Demand Index for the Washington MLS market area rose 16 percent in February to a reading of 117, reflecting an increase from a Steady to a Moderate level of buyer interest. The Index was virtually unchanged compared with the same period one year earlier.
Buyer interest rose for each type of home in February with the highest level of demand in the higher-priced single-family and condo segments. Except for lower-priced single-family homes, demand was as high, or higher, than one year earlier. While demand rose over the month, would-be buyers found their home search challenging. The months supply of single-family homes ranged from 0.8 to two months. The months supply of townhouses was just as challenging at one month. Only condos recorded a months supply greater than two.
Monthly Statistics for March 2021
Home Demand Index
117
(Moderate)
Home Demand Index from prior month
101
Home Demand Index from prior year
116
Index change from prior month
15.8%
Index change from same time last year
0.9%
Bright MLS | T3 Home Demand Index
www.homedemandindex.com
Download tile as an image.
Embed this tile on your site.
Washington D.C. | March 2021
Home Demand Index | Historical Year-over-Year Comparison
Home demand rose for the second consecutive month in February. Even after the unusually high level of buyer demand in the second half of 2020, early indications are that buyer interest in Washington area homes will retrace the seasonal rise experienced last spring. Low mortgage rates, an improving economy, and the desire by some buyers to purchase a larger home have all contributed to the most recent rise in demand.
Home Demand Index
Bright MLS | T3 Home Demand Index
www.homedemandindex.com
Download the top-level Market Areas map as a screenshot.
Embed this tile on your site.
Washington D.C. | March 2021
Home Demand Map
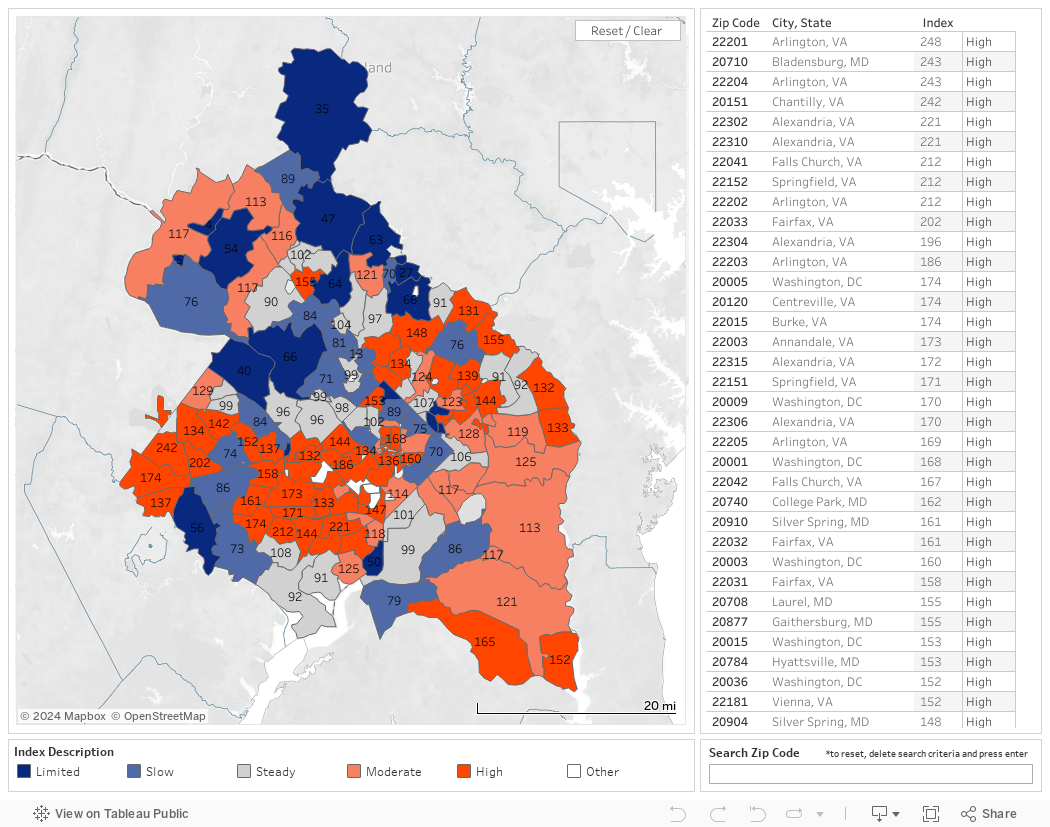
The Bright MLS | T3 Home Demand Index was in the High category in 40 percent of Washington market ZIP codes. Many of these communities were concentrated in the nearby Virginia and Maryland suburbs. An additional 16 percent of ZIP codes recorded a reading in the Moderate category and were clustered in the outer-ring suburbs of Maryland. Fewer than one-quarter of ZIP codes exhibited buyer interest that was either Slow or Limited, further highlighting the resilient level of demand in the region.
Bright MLS | T3 Home Demand Index
www.homedemandindex.com
Download tile as an image.
Embed this tile on your site.
Washington D.C. | March 2021
Demand and Inventory by Home Type
Buyer interest rose for each type of home in February with the highest level of demand in the higher-priced single-family and condo segments. Except for lower-priced single-family homes, demand was as high, or higher, than one year earlier. While demand rose over the month, would-be buyers found their home search challenging. The months supply of single-family homes ranged from 0.8 to two months. The months supply of townhouses was just as challenging at one month. Only condos recorded a months supply greater than two.
Bright MLS | T3 Home Demand Index
www.homedemandindex.com
Download tile as an image.
Washington D.C. | March 2021
Single Family Home Below $395k
Demand for single-family homes priced below $395,000 rose 12 percent in February reflecting a Slow pace of buyer interest. Demand for homes in this segment was significantly below the level compared with one year earlier. One likely reason for this softness was the disproportionate impact of the economic recession on would-be buyers at this price point who also confronted rising prices and limited inventory. The months supply, at 1.2, was unchanged from the previous month.
Monthly Statistics for Single Family Home Below $395k
Home Demand Index
76
(Slow)
Home Demand Index from prior month
68
Home Demand Index from prior year
107
Months of inventory
1.2
Average daily inventory last month
334
Inventory sold last month
281
Bright MLS | T3 Home Demand Index
www.homedemandindex.com
Download tile as an image.
Washington D.C. | March 2021
Single Family Home $395k - $950k
Demand for mid-priced single-family homes rose 21 percent in February reflecting a Moderate level of buyer interest. The Bright MLS | T3 Home Demand Index was at virtually the same level as one year earlier. Buyers in this segment confronted extraordinarily tight inventory conditions with a months supply of 0.8, suggesting that many homes sold in just a few days.
Monthly Statistics for Single Family Home $395k - $950k
Home Demand Index
117
(Moderate)
Home Demand Index from prior month
97
Home Demand Index from prior year
115
Months of Inventory
0.8
Average daily inventory last month
760
Inventory sold last month
903
Bright MLS | T3 Home Demand Index
www.homedemandindex.com
Download tile as an image.
Washington D.C. | March 2021
Single Family Home Above $950k
The Bright MLS | T3 Home Demand Index for single-family homes priced above $950,000 rose 21 percent in February and crossed into the High demand category. Not only did the Index increase, but it was higher than the same month one year earlier. There was a two-month supply of homes for sale, a small decrease from the month before when the months supply was 2.1.
Monthly Statistics for Single Family Home Above $950k
Home Demand Index
146
(High)
Home Demand Index from prior month
121
Home Demand Index from prior year
138
Months of Inventory
2
Average daily inventory last month
534
Inventory sold last month
270
Bright MLS | T3 Home Demand Index
www.homedemandindex.com
Download tile as an image.
Washington D.C. | March 2021
Condo Below $570k
Demand for condos priced below $570,000 rose in February reflecting a High level of buyer interest. Compared with one year earlier, demand for condos was 24 percent higher. With 2.1 months supply available for sale, buyers were challenged in their search. Despite this constraint on the search for lower-priced condos, buyers were in a more favorable position than buyers searching for similarly priced single-family homes.
Monthly Statistics for Condo Below $570k
Home Demand Index
148
(High)
Home Demand Index from prior month
129
Home Demand Index from prior year
119
Months of Inventory
2.1
Average daily inventory last month
1,899
Inventory sold last month
914
Bright MLS | T3 Home Demand Index
www.homedemandindex.com
This is Tooltip!
Washington D.C. | March 2021
Condo Above $570k
Buyer interest in higher-priced condos rose in February and, like lower-priced condos, reflected a High level of demand. The Index was also markedly higher than one year earlier. There was a 3.6 months supply of condos for sale, down from the previous month’s reading of 4.6 months.
Monthly Statistics for Condo Above $570k
Home Demand Index
173
(High)
Home Demand Index from prior month
141
Home Demand Index from prior year
139
Months of Inventory
3.6
Average daily inventory last month
483
Inventory sold last month
133
Bright MLS | T3 Home Demand Index
www.homedemandindex.com
This is Tooltip!
Washington D.C. | March 2021
Townhouse/Rowhouse/Twin All prices
Townhouse/ Rowhouse/Twin All prices
The Bright MLS | T3 Home Demand Index for townhouses rose to a reading of 113 in February, which can be characterized as a Moderate level of buyer interest. Demand was little changed from the same period one year earlier, suggesting that this segment is largely retracing the trajectory of demand from last spring. Lean inventory conditions challenged would-be buyers with just a one-month supply of homes available for sale.
Monthly Statistics for Townhouse/Rowhouse/TwinAll prices
Home Demand Index
113
(Moderate)
Home Demand Index from prior month
99
Home Demand Index from prior year
112
Months of Inventory
1
Average daily inventory last month
1,208
Inventory sold last month
1,205
Bright MLS | T3 Home Demand Index
www.homedemandindex.com
Note
1. This report is generated with data from the following counties: Alexandria City, VA; Arlington, VA; Fairfax City, VA; Fairfax, VA; Falls Church City, VA; Montgomery, MD; Prince Georges, MD; Washington, DC
2. This report is for the March 2021 period with data collected from the previous month.
Released: March 11, 2021
Reference ID: 1143
Washington D.C. | March 2021
Home Demand Map (Zip Codes)
The Bright MLS | T3 Home Demand Index was in the High category in 40 percent of Washington market ZIP codes. Many of these communities were concentrated in the nearby Virginia and Maryland suburbs. An additional 16 percent of ZIP codes recorded a reading in the Moderate category and were clustered in the outer-ring suburbs of Maryland. Fewer than one-quarter of ZIP codes exhibited buyer interest that was either Slow or Limited, further highlighting the resilient level of demand in the region.
Bright MLS | T3 Home Demand Index
www.homedemandindex.com
Embed the Timeline
To embed the map on your website, copy and paste the code below. Please note that the ideal dimensions for displaying the map are 1312 pixels wide by 660 pixels high.
Embed the Map
To embed the map on your website, copy and paste the code below. Please note that the ideal dimensions for displaying the map are 1312 pixels wide by 1182 pixels high.
Embed the Housing Type Bar Chart
To embed the map on your website, copy and paste the code below. Please note that the ideal dimensions for displaying the map are 1312 pixels wide by 880 pixels high.