September 2024 Report
Washington D.C. Metro
Washington D.C. | September 2024
Home Demand Index
The Home Demand Index (HDI) for this report period stands at 77, which is unchanged from last year’s level but reflects a slight decline from last month’s 81. This trend suggests a softening of market conditions consistent with broader economic challenges impacting buyer activity. The year-over-year stability indicates that while demand remains subdued, it is not significantly worsening compared to last year.
The demand for single-family homes across various price points reflects a softening market trend, with entry-level and mid-range single-family homes both experiencing declines in buyer interest. Luxury single-family homes show a similar downward trend, albeit from a higher base of demand. Meanwhile, the condo market exhibits a relatively stable demand with minor fluctuations, and inventory levels remain constrained across all segments, maintaining a competitive market environment.

Monthly Statistics for September 2024
Home Demand
Index
Index
77
(Slow)
Home Demand Index
from prior month
from prior month
81
Home Demand Index
from prior year
from prior year
77
Index change
from prior month
from prior month
-4.9%
Index change from
same time last year
same time last year
0%
Bright MLS | T3 Home Demand Index
www.homedemandindex.com
Washington D.C. | September 2024
Home Demand Index | Historical Year-over-Year Comparison
The HDI shows that the market conditions have remained stable over the past year, with this month’s index at 77, identical to the same period last year but down from last month’s 81. This steady year-over-year performance suggests a market that is holding its ground amid broader economic pressures. However, the month-over-month decline reflects continued softness in buyer interest.
Home Demand Index
Bright MLS | T3 Home Demand Index
www.homedemandindex.com
Washington D.C. | September 2024
Home Demand Map
Demand for homes is strongest in Arlington County and Alexandria City, both categorized as “Moderate,” indicating robust buyer interest. In contrast, Fairfax City, Montgomery, and Frederick counties experienced “Limited” buyer interest, while other areas showed “Slow” activity levels. The Maryland-West Virginia Panhandle saw demand improve to “Moderate,” reflecting a healthy level of buyer engagement, while Southern Maryland maintained “Steady” demand, indicative of a stable market.
Bright MLS | T3 Home Demand Index
www.homedemandindex.com
Washington D.C. | September 2024
Demand and Inventory by Home Type
The demand for single-family homes across various price points reflects a softening market trend, with entry-level and mid-range single-family homes both experiencing declines in buyer interest. Luxury single-family homes show a similar downward trend, albeit from a higher base of demand. Meanwhile, the condo market exhibits a relatively stable demand with minor fluctuations, and inventory levels remain constrained across all segments, maintaining a competitive market environment.
Bright MLS | T3 Home Demand Index
www.homedemandindex.com
Washington D.C. | September 2024
Single Family Home Below $550k
For entry-level single-family homes, the Home Demand Index (HDI) stands at 73 this month, consistent with last month but slightly above last year’s 70. This indicates a steady level of buyer interest amid broader market challenges, reflecting cautious engagement from buyers. The unchanged index suggests that while demand remains stable, it is not improving significantly.

Monthly Statistics for Single Family Home Below $550k
Home Demand
Index
Index
73
(Slow)
Home Demand Index
from prior month
from prior month
73
Home Demand Index
from prior year
from prior year
70
Months of
inventory
inventory
2.2
Average daily inventory last month
860
Inventory sold
last month
last month
393
Bright MLS | T3 Home Demand Index
www.homedemandindex.com
Washington D.C. | September 2024
Single Family Home $550k - $1307k
The HDI for mid-range single-family homes is 69, down from last month’s 74 but matching last year’s level. This consistency suggests a continued slow pace of buyer interest, aligned with overall market softening trends. The steady year-over-year index indicates persistent challenges in stimulating demand in this segment.

Monthly Statistics for Single Family Home $550k - $1307k
Home Demand
Index
Index
69
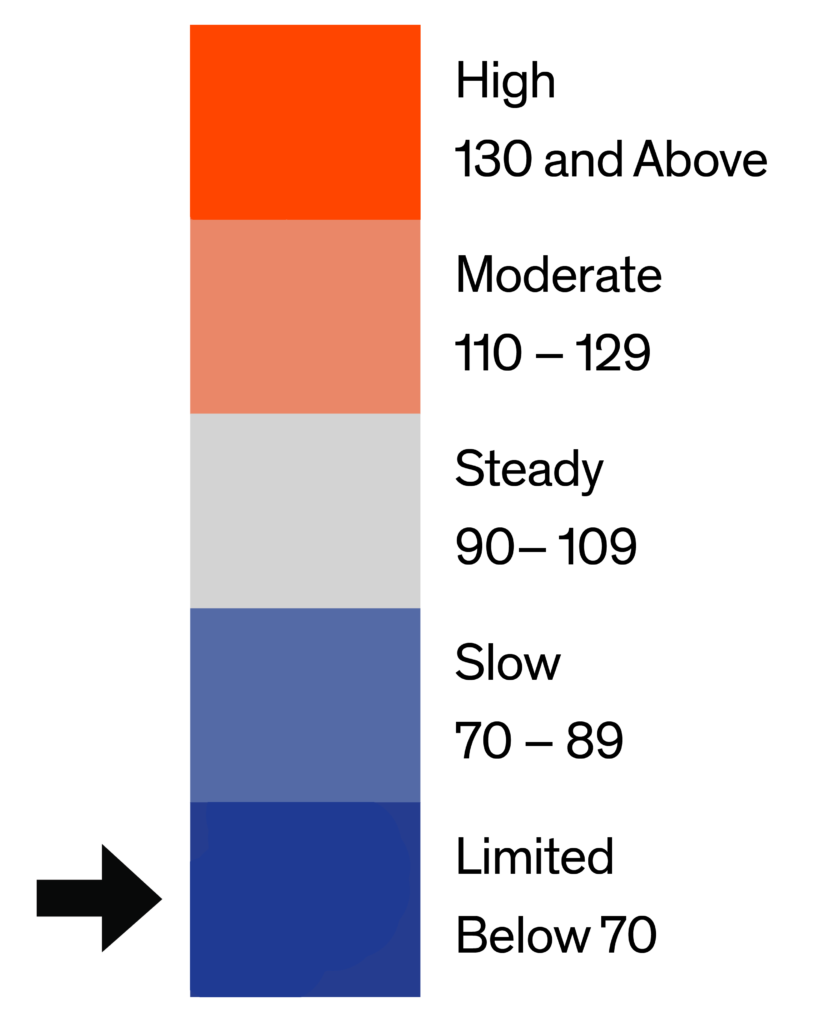
(Limited)
Home Demand Index
from prior month
from prior month
74
Home Demand Index
from prior year
from prior year
69
Months of
Inventory
Inventory
1.5
Average daily inventory last month
1,721
Inventory sold
last month
last month
1,142
Bright MLS | T3 Home Demand Index
www.homedemandindex.com
Washington D.C. | September 2024
Single Family Home Above $1307k
The HDI for luxury single-family homes is 83, reflecting a 10% decline from last month’s 92 and an 11% drop from last year’s 93. This suggests weakening buyer interest in the high-end market segment, likely influenced by affordability constraints or shifting market dynamics. Despite ongoing interest, the demand softening is evident.

Monthly Statistics for Single Family Home Above $1307k
Home Demand
Index
Index
83
(Slow)
Home Demand Index
from prior month
from prior month
92
Home Demand Index
from prior year
from prior year
93
Months of
Inventory
Inventory
2.7
Average daily inventory last month
686
Inventory sold
last month
last month
259
Bright MLS | T3 Home Demand Index
www.homedemandindex.com
Washington D.C. | September 2024
Condo Below $585k
For entry-level condos, the HDI is 95 this month, down slightly from last month’s 98 but slightly higher than last year’s 94. This indicates a stable demand with minor fluctuations, reflecting ongoing buyer engagement in this market segment. The slight month-over-month decline may result from seasonal factors or changing buyer preferences.

Monthly Statistics for Condo Below $585k
Home Demand
Index
Index
95
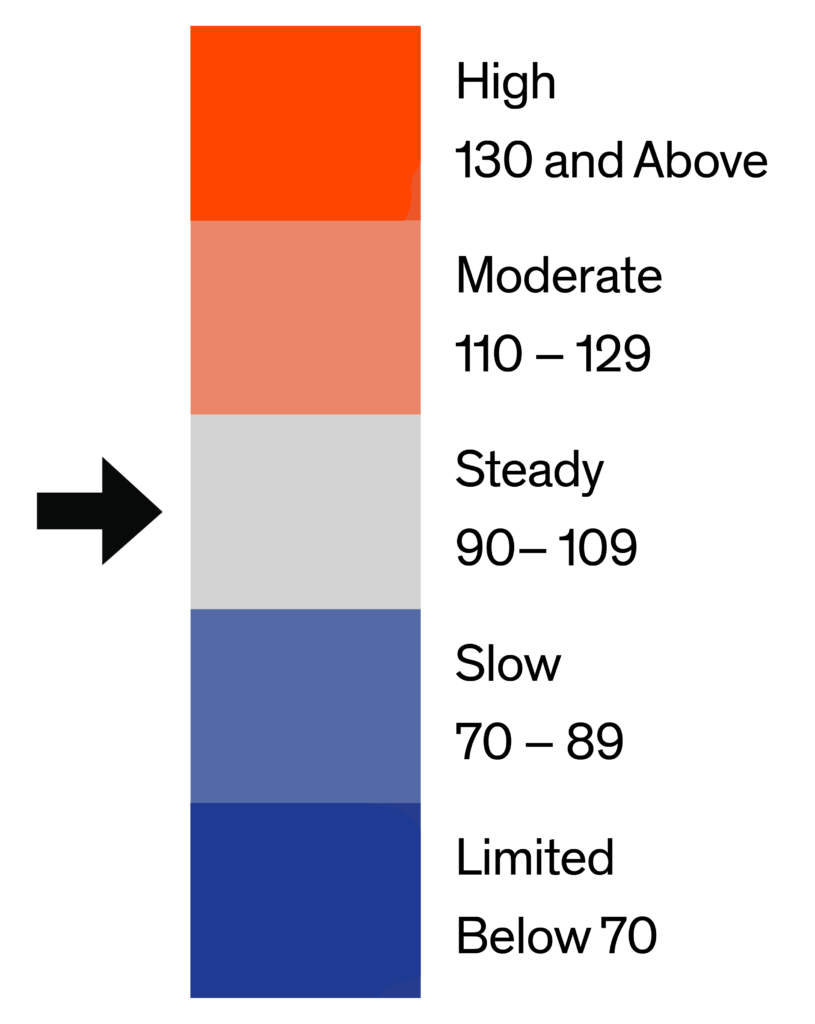
(Steady)
Home Demand Index
from prior month
from prior month
98
Home Demand Index
from prior year
from prior year
94
Months of
Inventory
Inventory
2.8
Average daily inventory last month
1,806
Inventory sold
last month
last month
639
Bright MLS | T3 Home Demand Index
www.homedemandindex.com
Washington D.C. | September 2024
Condo Above $585k
The HDI for luxury condos stands at 98, showing a decline from last month’s 109 and from last year’s 110. This reflects a continued moderation in buyer interest for high-end condos, likely due to evolving market conditions. The drop in the index highlights a contraction in demand, although it remains within a steady interest range.

Monthly Statistics for Condo Above $585k
Home Demand
Index
Index
98
(Steady)
Home Demand Index
from prior month
from prior month
109
Home Demand Index
from prior year
from prior year
110
Months of
Inventory
Inventory
3.3
Average daily inventory last month
420
Inventory sold
last month
last month
129
Bright MLS | T3 Home Demand Index
www.homedemandindex.com
Washington D.C. | September 2024
Townhouse/Rowhouse/Twin All prices
Townhouse/
Rowhouse/Twin
All prices
The HDI for townhouses, rowhouses, and twins is 76 for this report period, down from last month’s 81 and slightly below last year’s 77. This reflects a slow pace of buyer interest, consistent with overall market softness. The decline in the index suggests ongoing challenges in attracting buyers despite slight year-over-year improvements in inventory levels.

Monthly Statistics for Townhouse/Rowhouse/TwinAll prices
Home Demand
Index
Index
76
(Slow)
Home Demand Index
from prior month
from prior month
81
Home Demand Index
from prior year
from prior year
77
Months of
Inventory
Inventory
2.1
Average daily inventory last month
2,438
Inventory sold
last month
last month
1,183
Bright MLS | T3 Home Demand Index
www.homedemandindex.com
Note
1. This report is generated with data from the following counties:
- Maryland-West Virginia Panhandle – Allegany, MD; Berkeley, WV; Garrett, MD; Grant, WV; Hampshire, WV; Hardy, WV; Jefferson, WV; Mineral, WV; Morgan, WV; Pendleton, WV; Washington, MD;
- North Central Virginia – Caroline, VA; Clarke, VA; Culpeper, VA; Fauquier, VA; Frederick, VA; Fredericksburg City, VA; King George, VA; Madison, VA; Manassas City, VA; Orange, VA; Page, VA; Prince William, VA; Rappahannock, VA; Shenandoah, VA; Spotsylvania, VA; Stafford, VA; Warren, VA; Winchester City, VA;
- Southern Maryland – Calvert, MD; Charles, MD; Saint Marys, MD;
- Washington D.C. Metro – Alexandria City, VA; Arlington, VA; Fairfax, VA; Falls Church City, VA; Frederick, MD; Loudoun, VA; Montgomery, MD; Prince Georges, MD; Washington, DC;
2. This report is for the September 2024 period with data collected from the previous month.
Released: September 11, 2024
Reference ID: 2110
Washington D.C. | September 2024
Home Demand Map (Zip Codes)
Demand for homes is strongest in Arlington County and Alexandria City, both categorized as “Moderate,” indicating robust buyer interest. In contrast, Fairfax City, Montgomery, and Frederick counties experienced “Limited” buyer interest, while other areas showed “Slow” activity levels. The Maryland-West Virginia Panhandle saw demand improve to “Moderate,” reflecting a healthy level of buyer engagement, while Southern Maryland maintained “Steady” demand, indicative of a stable market.

Bright MLS | T3 Home Demand Index
www.homedemandindex.com