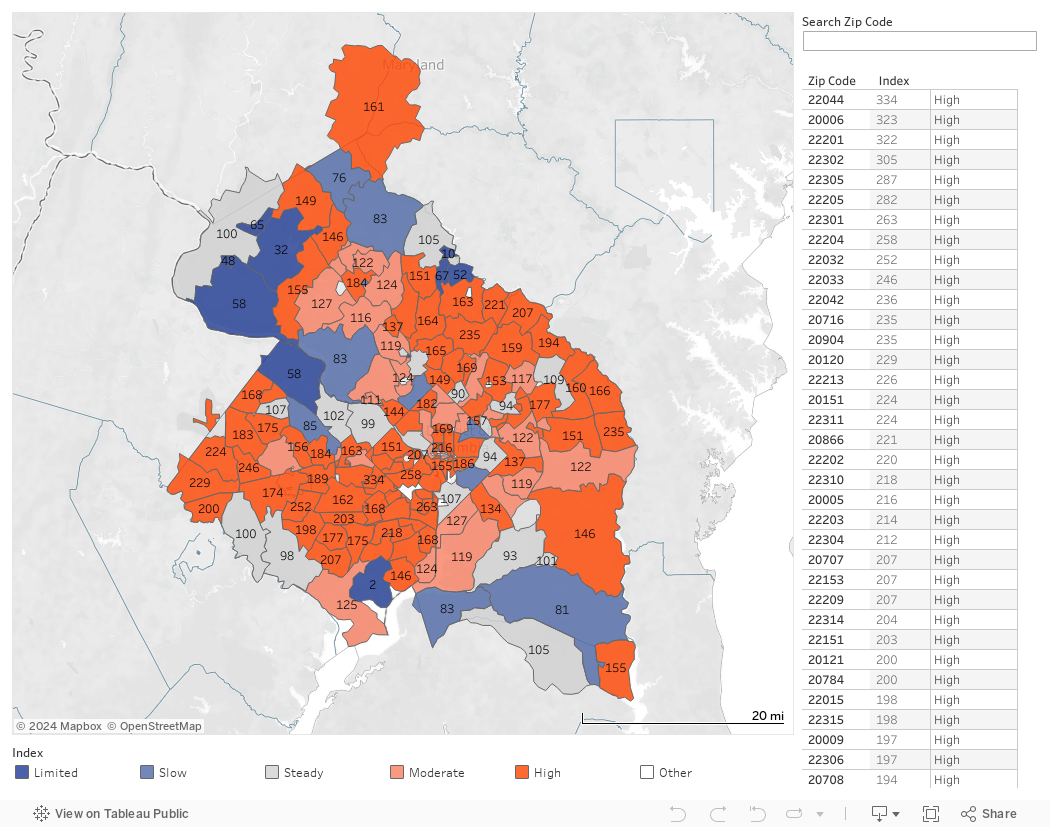
While buyer interest was generally solid in October, demand for lower-priced single-family homes was a soft spot. The strongest demand was in the higher-priced single-family and condo segments. Overall, the latest data reflect a residential market where buyer demand remained elevated compared with the pace of one year earlier.
Inventory conditions in the Washington market area remained extremely tight among most types of homes. The months supply across the three price tiers of single-family homes, which accounted for nearly half of sales in October, ranged from one to 2.2. Supply conditions were more favorable in the condo segments but still presented a challenge for buyers when searching for their next home.