December 2020 Report
Washington D.C. Metro
Washington D.C. | December 2020
Home Demand Index
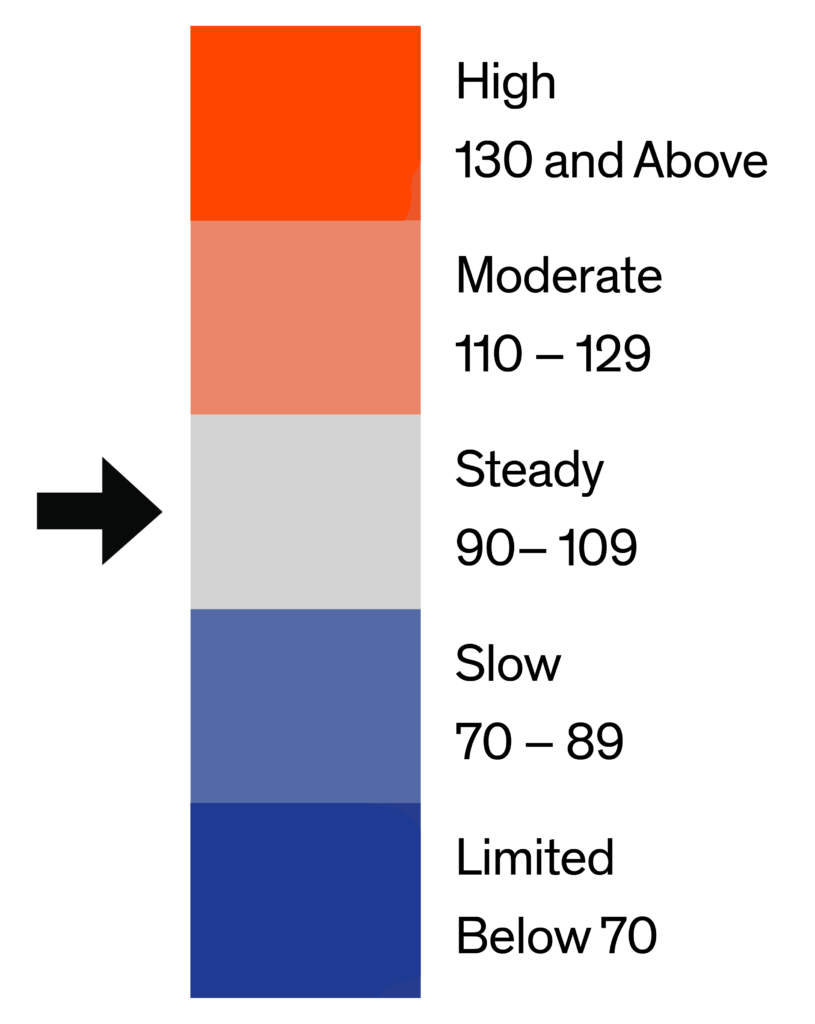
The Bright MLS | T3 Home Demand Index for the Washington MLS market area fell 26 percent in November to a reading of 108, indicating Steady buyer demand. The Index remained above the year-earlier level as homebuyers looked to take advantage of favorable mortgage interest rates even as the search for homes was hampered by low inventory in some market segments.
The Bright MLS | T3 Home Demand Index fell in November for each type of home. Except for the lowest-priced single-family home segment of the market, the level of buyer interest remained higher than one year ago. The generally lower level of buyer demand in November is consistent with the typical pullback in activity at the end of the year, especially considering the rapid pace of activity during the summer and fall. Inventory conditions remained very tight in the single-family home segments, ranging from one to 2.3 months supply.

Monthly Statistics for December 2020
Home Demand
Index
Index
108
(Steady)
Home Demand Index
from prior month
from prior month
146
Home Demand Index
from prior year
from prior year
88
Index change
from prior month
from prior month
-26%
Index change from
same time last year
same time last year
22.7%
Bright MLS | T3 Home Demand Index
www.homedemandindex.com
Washington D.C. | December 2020
Home Demand Index | Historical Year-over-Year Comparison
Since June, the Bright MLS | T3 home Demand Index has been above the year-earlier level, supported by several forces in the market. Among them, a bounce back from the Covid-19 pandemic restrictions in the spring that temporarily sidelined many homebuyers and record low mortgage interest rates that buyers rushed to lock-in.
The decline on the Index in November, while steep at 26 percent, also reflected the usual slowdown in buyer interest the follows the peak months of spring and summer. In 2019, for example, the Index decreased by 13 percent between October and November.
Home Demand Index
Bright MLS | T3 Home Demand Index
www.homedemandindex.com
Washington D.C. | December 2020
Home Demand Map
The softening of demand in November also played out across many of the submarkets in the region. Approximately one-third of ZIP codes in the Washington market area recorded a Bright MLS | T3 Home Demand Index in the High category compared with more than half in this category in October. At the other end of the scale, one-third of ZIP codes had an Index reading of Slow or Limited in November compared with 13 percent the previous month.
Bright MLS | T3 Home Demand Index
www.homedemandindex.com
Washington D.C. | December 2020
Demand and Inventory by Home Type
The Bright MLS | T3 Home Demand Index fell in November for each type of home. Except for the lowest-priced single-family home segment of the market, the level of buyer interest remained higher than one year ago. The generally lower level of buyer demand in November is consistent with the typical pullback in activity at the end of the year, especially considering the rapid pace of activity during the summer and fall. Inventory conditions remained very tight in the single-family home segments, ranging from one to 2.3 months supply.
Bright MLS | T3 Home Demand Index
www.homedemandindex.com
Washington D.C. | December 2020
Single Family Home Below $395k
Buyer interest in single-family homes priced below $395,000 crossed into the Slow category with a 16 percent decrease in November. For the past several months, this type of home has had the softest level of demand compared with other segments of the single-family market. This slowdown in buyer interest can be attributed, in part, to the outsized impact of the economic recession on households looking for homes at this price point. In November, the inventory of homes for sales was equivalent to just 1.3 months, up marginally from the previous month’s reading.

Monthly Statistics for Single Family Home Below $395k
Home Demand
Index
Index
84
(Slow)
Home Demand Index
from prior month
from prior month
100
Home Demand Index
from prior year
from prior year
97
Months of
inventory
inventory
1.3
Average daily inventory last month
496
Inventory sold
last month
last month
374
Bright MLS | T3 Home Demand Index
www.homedemandindex.com
Washington D.C. | December 2020
Single Family Home $395k - $950k
Following a high-flying month in October, buyer interest in single-family homes priced between $395,000 and $950,000 weakened in November. The Index dropped by 30 percent over the month to a Steady pace of activity. Although the level of buyer interest retreated during the month, the Index was still 20 percent above the year-earlier level. A strong sellers’ market prevailed with just a one-month supply of homes available for sale in November.

Monthly Statistics for Single Family Home $395k - $950k
Home Demand
Index
Index
101
(Steady)
Home Demand Index
from prior month
from prior month
144
Home Demand Index
from prior year
from prior year
84
Months of
Inventory
Inventory
1
Average daily inventory last month
1,368
Inventory sold
last month
last month
1,395
Bright MLS | T3 Home Demand Index
www.homedemandindex.com
Washington D.C. | December 2020
Single Family Home Above $950k
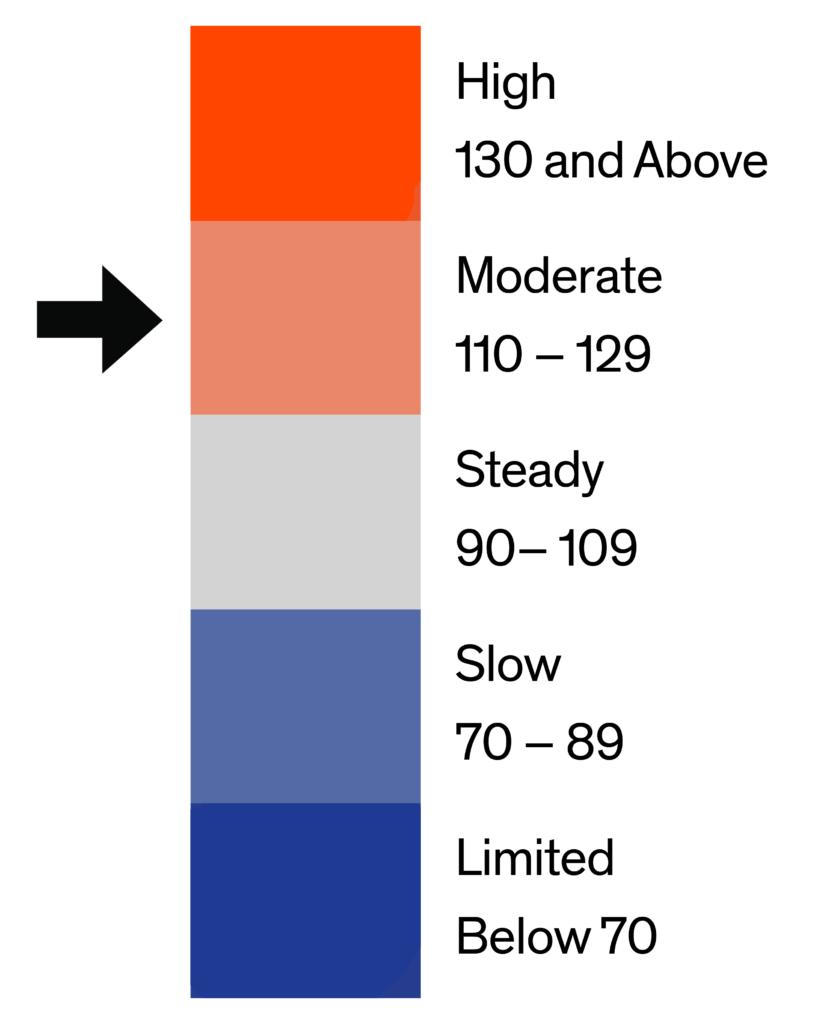
The Index for single-family homes priced above $950,000 fell in November reflecting a level of buyer interest characterized as Moderate. The Index decreased by 34 percent compared with October but remained above the level of one year earlier. This segment of the market retreated from a High level of buyer interest in October, due, in part, to a seasonal decline in buyer interest as well as challenging inventory conditions limiting buyers’ ability to find the right home. The months supply of homes available for sale was only 2.3 in November.

Monthly Statistics for Single Family Home Above $950k
Home Demand
Index
Index
117
(Moderate)
Home Demand Index
from prior month
from prior month
178
Home Demand Index
from prior year
from prior year
80
Months of
Inventory
Inventory
2.3
Average daily inventory last month
884
Inventory sold
last month
last month
381
Bright MLS | T3 Home Demand Index
www.homedemandindex.com
Washington D.C. | December 2020
Condo Below $570k
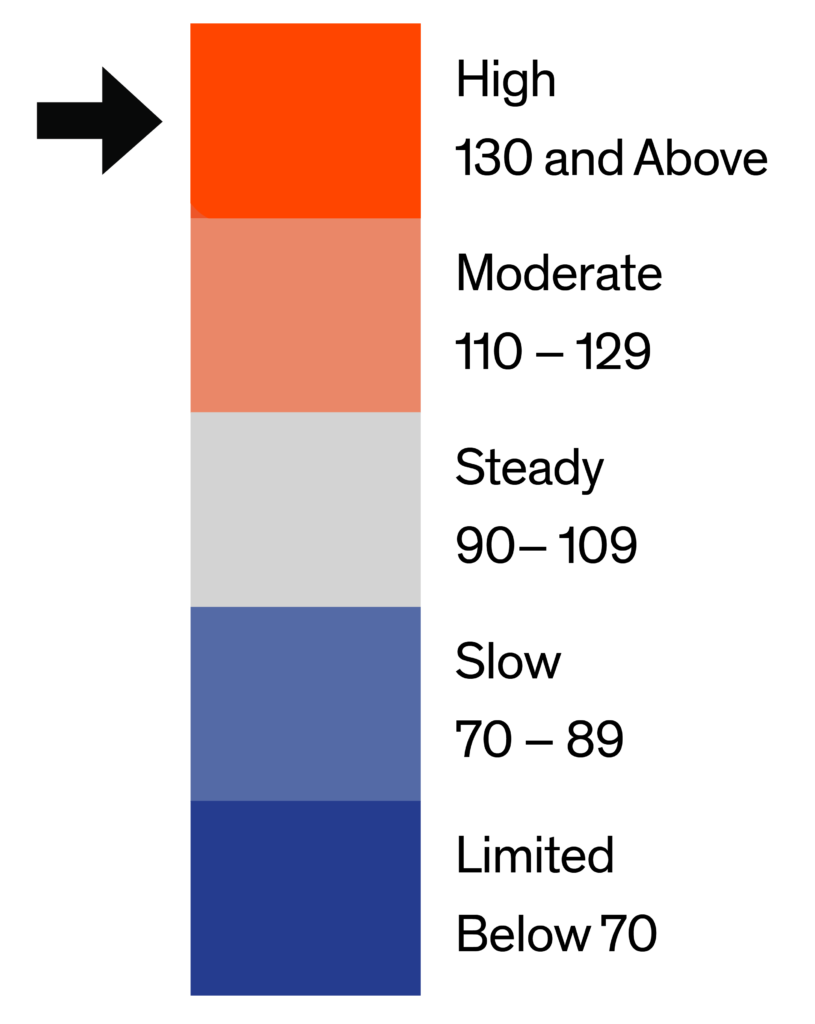
Buyer interest in condos priced below $570,000 fell in November but remained in the High category, Despite the decline, the Index was still 52 percent ahead of last year. Would-be buyers looking for a condo at this price point still faced some challenges in their search. The months supply in November stood at three, an increase from 2.5 in October.

Monthly Statistics for Condo Below $570k
Home Demand
Index
Index
131
(High)
Home Demand Index
from prior month
from prior month
167
Home Demand Index
from prior year
from prior year
86
Months of
Inventory
Inventory
3
Average daily inventory last month
2,545
Inventory sold
last month
last month
842
Bright MLS | T3 Home Demand Index
www.homedemandindex.com
Washington D.C. | December 2020
Condo Above $570k
The demand for condos priced above $570,000 was still elevated in November despite a decrease of 23 percent over the month. Even with the decline in the Index, buyer interest was still significantly greater than one year earlier and characterized as High. Buyers searching for a property found more favorable inventory conditions than other segments of the Washington market with a four-month supply in November.

Monthly Statistics for Condo Above $570k
Home Demand
Index
Index
134
(High)
Home Demand Index
from prior month
from prior month
175
Home Demand Index
from prior year
from prior year
90
Months of
Inventory
Inventory
4
Average daily inventory last month
588
Inventory sold
last month
last month
148
Bright MLS | T3 Home Demand Index
www.homedemandindex.com
Washington D.C. | December 2020
Townhouse/Rowhouse/Twin All prices
Townhouse/
Rowhouse/Twin
All prices
While the townhouse segment experienced a High level of demand in October, buyer interest fell significantly in November. Although decreasing by 25 percent, the Index remained higher than one year ago, suggesting continued interest even as the expected seasonal slowdown took hold at the end of the year. Inventory conditions for buyers remained tight at 1.3 months supply.

Monthly Statistics for Townhouse/Rowhouse/TwinAll prices
Home Demand
Index
Index
112
(Moderate)
Home Demand Index
from prior month
from prior month
150
Home Demand Index
from prior year
from prior year
91
Months of
Inventory
Inventory
1.3
Average daily inventory last month
2,120
Inventory sold
last month
last month
1,613
Bright MLS | T3 Home Demand Index
www.homedemandindex.com
Note
1. This report is generated with data from the following counties: Alexandria City, VA; Arlington, VA; Fairfax City, VA; Fairfax, VA; Falls Church City, VA; Montgomery, MD; Prince Georges, MD; Washington, DC
2. This report is for the December 2020 period with data collected from the previous month.
Released: March 3, 2021
Reference ID: 1066
Washington D.C. | December 2020
Home Demand Map (Zip Codes)
The softening of demand in November also played out across many of the submarkets in the region. Approximately one-third of ZIP codes in the Washington market area recorded a Bright MLS | T3 Home Demand Index in the High category compared with more than half in this category in October. At the other end of the scale, one-third of ZIP codes had an Index reading of Slow or Limited in November compared with 13 percent the previous month.
Bright MLS | T3 Home Demand Index
www.homedemandindex.com