Share report on Facebook!
Share on facebook
Share report on Twitter!
Share on twitter
Share report on LinkedIn!
Share on linkedin
Email a link to this Report!
Share on email
Download tile as an image.

Washington D.C. | December 2022

Home Demand Index

The Bright MLS | T3 Home Demand Index for the Washington Metro area decreased 16.7 percent in November to 75 reflecting a Slow pace of market activity. The HDI was 22.7 percent lower than the same month one year earlier.
Demand for all types of homes fell over the month. The HDI for higher-priced single-family homes fell the most, decreasing 26 percent in November, followed by a 19 percent decline for higher-priced condos and townhouses. Although decreasing more than any other segment over the month, the Moderate pace of demand for higher-priced single-family homes was greater than any other segment in November. Buyer interest was Limited for lower-priced single-family homes, Steady for higher-priced condos and Slow among the remaining market segments. The months supply of inventory rose for each type of home in November. The months supply ranged from 2.5 months for townhouses to 4.6 months for higher-priced condos.
Monthly Statistics for December 2022
Home Demand
Index
75
(Slow)
Home Demand Index
from prior month
90
Home Demand Index
from prior year
97
Index change
from prior month
-16.7%
Index change from
same time last year
-22.7%
Bright MLS | T3 Home Demand Index

www.homedemandindex.com

Download tile as an image.
Embed this tile on your site.

Washington D.C. | December 2022

Home Demand Index | Historical Year-over-Year Comparison

Demand for homes in the Washington Metro area has fallen sharply since September with the Index down by nearly 30 percent over the past two months. The Index has been below year-earlier levels for more than 12 months as the cumulative impact of higher mortgage rates added to challenging affordability conditions that have reduced buyer activity. Uncertainty about the likelihood of a recession has also contributed to softer demand.

Home Demand Index

Bright MLS | T3 Home Demand Index

www.homedemandindex.com

Download the top-level Market Areas map as a screenshot.

Embed this tile on your site.

Washington D.C. | December 2022

Home Demand Map

Buyer interest was strongest in Arlington County and Alexandria City with an Index in the Moderate range. Demand was Slow in Prince Georges and Fairfax counties along with Washington, DC. and Limited elsewhere in the metro area. The Index decreased over the month in each Washington Metro area county. The HDI was in the Steady range in the Southern Maryland and Maryland-West Virginia Panhandle market areas and Slow in the North Central Virginia region. Across the Greater Washington area, demand for homes in two-thirds of ZIP codes was in the Slow or Limited range compared with slightly more than half in October. Demand in one-in-ten ZIP codes was in the High range in November compared with 17 percent in October.
Bright MLS | T3 Home Demand Index

www.homedemandindex.com

Download tile as an image.
Embed this tile on your site.

Washington D.C. | December 2022

Demand and Inventory by Home Type

Demand for all types of homes fell over the month. The HDI for higher-priced single-family homes fell the most, decreasing 26 percent in November, followed by a 19 percent decline for higher-priced condos and townhouses. Although decreasing more than any other segment over the month, the Moderate pace of demand for higher-priced single-family homes was greater than any other segment in November. Buyer interest was Limited for lower-priced single-family homes, Steady for higher-priced condos and Slow among the remaining market segments. The months supply of inventory rose for each type of home in November. The months supply ranged from 2.5 months for townhouses to 4.6 months for higher-priced condos.
Bright MLS | T3 Home Demand Index

www.homedemandindex.com

Download tile as an image.

Washington D.C. | December 2022

Single Family Home Below $395k

Demand for lower-priced single-family homes in the Washington Metro area drifted lower in November. The Index, at 34, remained in the Limited range where it has been for several months. Reflecting the weak demand, the number sales in November fell resulting in an uptick in the months supply to 2.9 months from 2.5 months in October.
Monthly Statistics for Single Family Home Below $395k
Home Demand
Index
34
(Limited)
Home Demand Index
from prior month
37
Home Demand Index
from prior year
52
Months of
inventory
2.9
Average daily inventory last month
421
Inventory sold
last month
147
Bright MLS | T3 Home Demand Index

www.homedemandindex.com

Download tile as an image.

Washington D.C. | December 2022

Single Family Home $395k - $950k

The Bright MLS | T3 Home Demand Index for mid-priced single-family homes fell 13 percent to 82, indicating a Slow pace of buyer activity. Demand was in the Steady category one year earlier, an indication of the extent to which buyer activity has slowed during the past 12 months. The months supply rose to 2.7 months from 2.3 months.
Monthly Statistics for Single Family Home $395k - $950k
Home Demand
Index
82
(Slow)
Home Demand Index
from prior month
94
Home Demand Index
from prior year
100
Months of
Inventory
2.7
Average daily inventory last month
2,266
Inventory sold
last month
854
Bright MLS | T3 Home Demand Index

www.homedemandindex.com

Download tile as an image.

Washington D.C. | December 2022

Single Family Home Above $950k

Buyer interest in higher-priced single-family homes was Moderate in November, down from a High level of demand in October. The Index decreased 26 percent over the month to 117. In contrast to other segments of the Washington Metro market, demand was only slightly lower than one year earlier suggesting some resilience to headwinds in the market. The months supply, at 2.7, was up marginally over the month.
Monthly Statistics for Single Family Home Above $950k
Home Demand
Index
117
(Moderate)
Home Demand Index
from prior month
159
Home Demand Index
from prior year
126
Months of
Inventory
2.7
Average daily inventory last month
899
Inventory sold
last month
333
Bright MLS | T3 Home Demand Index

www.homedemandindex.com

Download tile as an image.

Washington D.C. | December 2022

Condo Below $570k

Like all other segments of the market, the demand for lower-priced condos decreased in November. The Index fell 17 percent to 82, a level consistent with a Slow pace of buyer activity. The Index was nearly one-third lower than one year earlier. The months supply of homes, at 2.8, was unchanged from October.
Monthly Statistics for Condo Below $570k
Home Demand
Index
82
(Slow)
Home Demand Index
from prior month
99
Home Demand Index
from prior year
118
Months of
Inventory
2.8
Average daily inventory last month
1,539
Inventory sold
last month
545
Bright MLS | T3 Home Demand Index

www.homedemandindex.com

This is Tooltip!

Washington D.C. | December 2022

Condo Above $570k

Buyer interest in higher-priced condos declined in November. The Index was down by nearly one-fifth over the month with demand moving from Moderate to Steady and by 25 percent compared with one year earlier. The months supply rose to 4.6 in November compared with 4.3 months in October.
Monthly Statistics for Condo Above $570k
Home Demand
Index
104
(Steady)
Home Demand Index
from prior month
128
Home Demand Index
from prior year
139
Months of
Inventory
4.6
Average daily inventory last month
459
Inventory sold
last month
99
Bright MLS | T3 Home Demand Index

www.homedemandindex.com

This is Tooltip!

Washington D.C. | December 2022

Townhouse/Rowhouse/Twin All prices

Townhouse/
Rowhouse/Twin
All prices

Demand for townhouses was Slow in November with the Bright MLS | T3 Home Demand Index decreasing by 19 percent to 78 over the month. The Index was also 25 percent lower than one year earlier. The months supply rose marginally to 2.5 months.
Monthly Statistics for Townhouse/Rowhouse/TwinAll prices
Home Demand
Index
78
(Slow)
Home Demand Index
from prior month
96
Home Demand Index
from prior year
104
Months of
Inventory
2.5
Average daily inventory last month
2,559
Inventory sold
last month
1,009
Bright MLS | T3 Home Demand Index

www.homedemandindex.com

Note

1. This report is generated with data from the following counties:
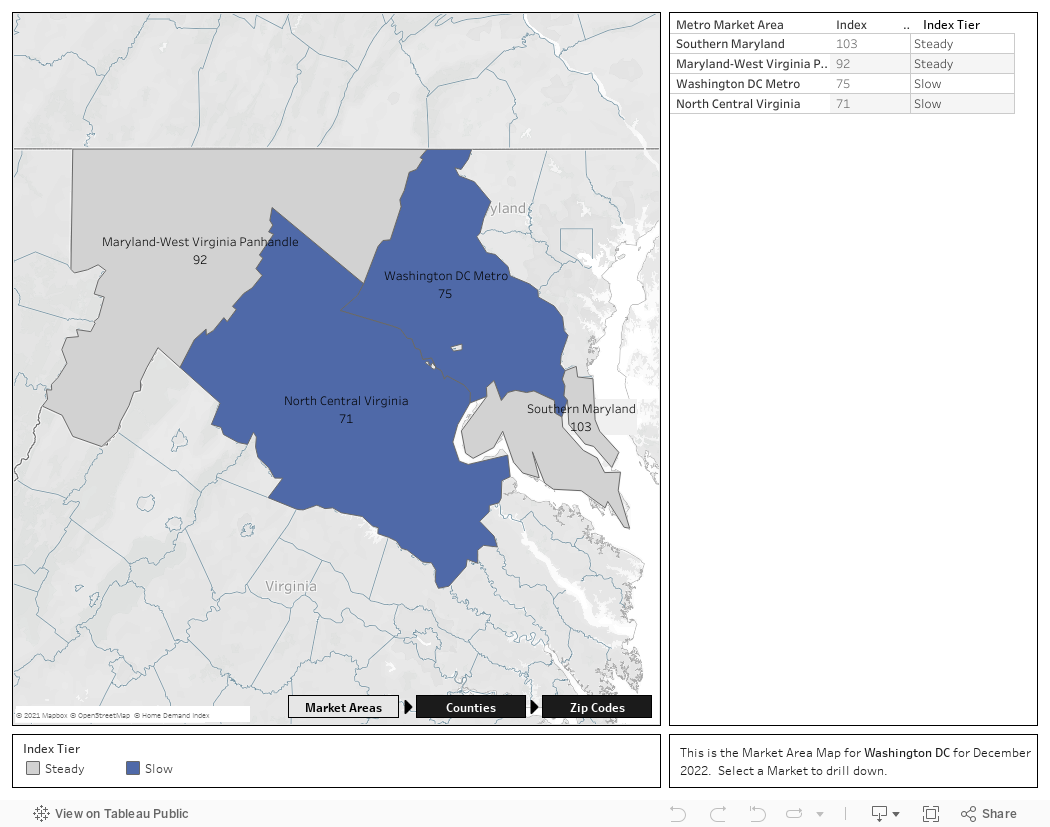
  • Maryland-West Virginia Panhandle – Allegany, MD; Berkeley, WV; Garrett, MD; Grant, WV; Hampshire, WV; Hardy, WV; Jefferson, WV; Mineral, WV; Morgan, WV; Pendleton, WV; Washington, MD;
  • North Central Virginia – Caroline, VA; Clarke, VA; Culpeper, VA; Fauquier, VA; Frederick, VA; Fredericksburg City, VA; King George, VA; Madison, VA; Manassas City, VA; Orange, VA; Page, VA; Prince William, VA; Rappahannock, VA; Shenandoah, VA; Spotsylvania, VA; Stafford, VA; Warren, VA; Winchester City, VA;
  • Southern Maryland – Calvert, MD; Charles, MD; Saint Marys, MD;
  • Washington D.C. Metro – Alexandria City, VA; Arlington, VA; Fairfax, VA; Falls Church City, VA; Frederick, MD; Loudoun, VA; Montgomery, MD; Prince Georges, MD; Washington, DC;
2. This report is for the December 2022 period with data collected from the previous month.
Released: December 11, 2022
Reference ID: 1732

Washington D.C. | December 2022

Home Demand Map (Zip Codes)

Buyer interest was strongest in Arlington County and Alexandria City with an Index in the Moderate range. Demand was Slow in Prince Georges and Fairfax counties along with Washington, DC. and Limited elsewhere in the metro area. The Index decreased over the month in each Washington Metro area county. The HDI was in the Steady range in the Southern Maryland and Maryland-West Virginia Panhandle market areas and Slow in the North Central Virginia region. Across the Greater Washington area, demand for homes in two-thirds of ZIP codes was in the Slow or Limited range compared with slightly more than half in October. Demand in one-in-ten ZIP codes was in the High range in November compared with 17 percent in October.
Bright MLS | T3 Home Demand Index

www.homedemandindex.com

Embed the Timeline

To embed the map on your website, copy and paste the code below. Please note that the ideal dimensions for displaying the map are 1312 pixels wide by 660 pixels high.

Embed the Map

To embed the map on your website, copy and paste the code below. Please note that the ideal dimensions for displaying the map are 1312 pixels wide by 1182 pixels high.

Embed the Housing Type Bar Chart

To embed the map on your website, copy and paste the code below. Please note that the ideal dimensions for displaying the map are 1312 pixels wide by 880 pixels high.