August 2025 Report
Washington D.C. Metro
Washington D.C. | August 2025
Home Demand Index
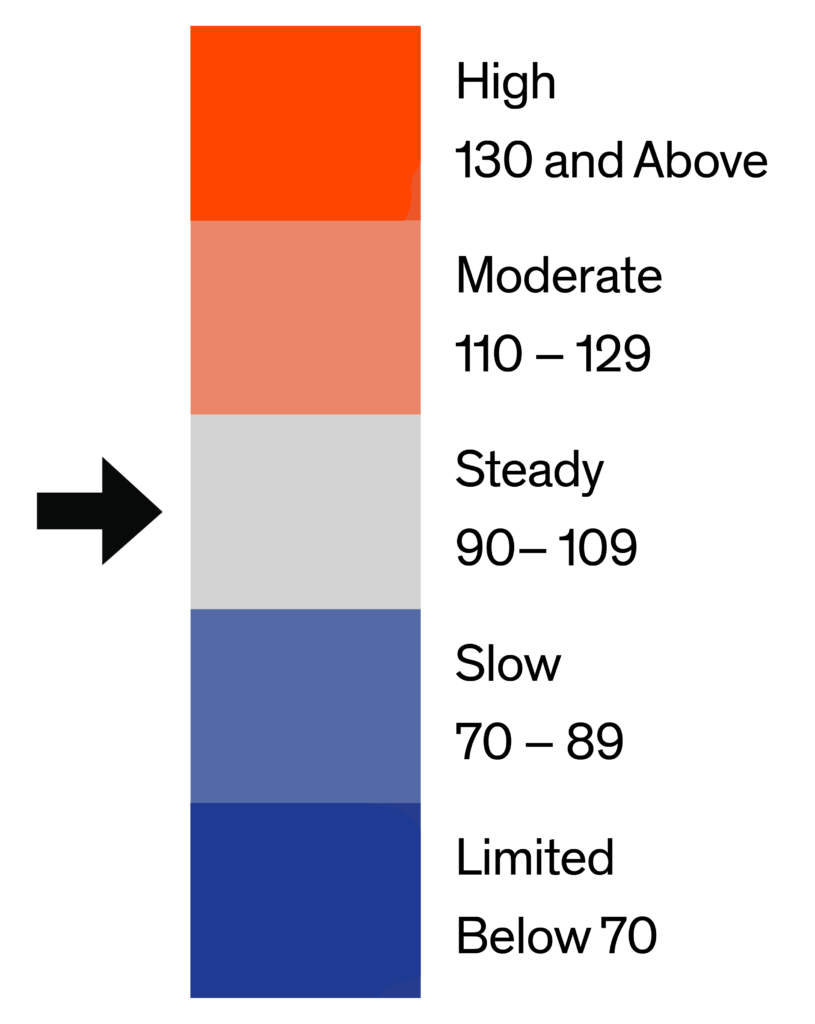
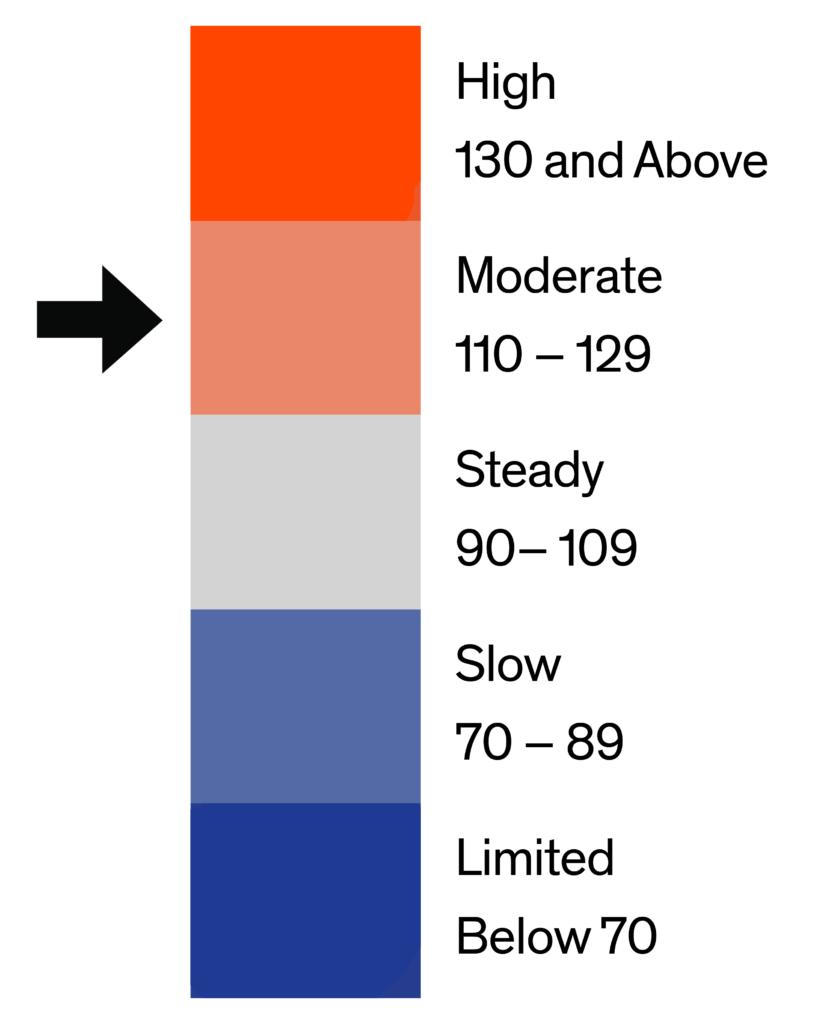
The Home Demand Index (HDI) for the Washington D.C. metro area fell to 89 in the latest report, down from 98 the previous month. This ongoing decline reflects a typical seasonal slowdown, as buyer activity tends to ease during the later summer months. Still, demand remains higher than the same period last year, when the index stood at 82. The year-over-year increase points to a more active market overall, with buyer interest holding steady compared to last year.
Demand continues to soften across all home types in Washington D.C. for the second consecutive month, though levels remain higher than a year ago. The luxury single-family home segment experienced the largest decline but still shows the strongest year-over-year growth. Luxury condos also recorded notable decreases, while entry-level single-family homes and townhouses saw the smallest decline among all segments, with a 7% drop compared to the previous month. Overall, demand is moderating in the short term but remains above last year across most segments, highlighting the continued impact of limited inventory on market dynamics.

Monthly Statistics for August 2025
Home Demand
Index
Index
89
(Slow)
Home Demand Index
from prior month
from prior month
98
Home Demand Index
from prior year
from prior year
82
Index change
from prior month
from prior month
-9.2%
Index change from
same time last year
same time last year
8.5%
Bright MLS | T3 Home Demand Index
www.homedemandindex.com
Washington D.C. | August 2025
Home Demand Index | Historical Year-over-Year Comparison
The Home Demand Index (HDI) for the Washington D.C. metro area decreased to 89 this month, following a reading of 98 last month. This reduction aligns with the usual seasonal cooling seen in summer months. Nevertheless, the index remains above last year’s figure of 82, highlighting sustained buyer interest compared to the previous year.
Home Demand Index
Bright MLS | T3 Home Demand Index
www.homedemandindex.com
Washington D.C. | August 2025
Home Demand Map
Buyer demand across the Washington D.C. region continues to show significant geographic variation. Core areas such as Arlington County and Alexandria City remain among the strongest performers, maintaining higher levels of buyer interest. Fairfax City, Fairfax, and Loudoun Counties are steady. In contrast, Frederick County falls into the limited category, while the remaining areas are experiencing slow demand.
Bright MLS | T3 Home Demand Index
www.homedemandindex.com
Washington D.C. | August 2025
Demand and Inventory by Home Type
Demand continues to soften across all home types in Washington D.C. for the second consecutive month, though levels remain higher than a year ago. The luxury single-family home segment experienced the largest decline but still shows the strongest year-over-year growth. Luxury condos also recorded notable decreases, while entry-level single-family homes and townhouses saw the smallest decline among all segments, with a 7% drop compared to the previous month. Overall, demand is moderating in the short term but remains above last year across most segments, highlighting the continued impact of limited inventory on market dynamics.
Bright MLS | T3 Home Demand Index
www.homedemandindex.com
Washington D.C. | August 2025
Single Family Home Below $565k
The index for entry-level single-family homes in Washington, D.C. decreased to 76 from 82 last month, remaining just above last year’s level of 75. This month-over-month drop indicates continued slow buyer demand, while the slight year-over-year increase suggests that market activity is holding steady despite ongoing challenges.

Monthly Statistics for Single Family Home Below $565k
Home Demand
Index
Index
76
(Slow)
Home Demand Index
from prior month
from prior month
82
Home Demand Index
from prior year
from prior year
75
Months of
inventory
inventory
2.8
Average daily inventory last month
1,166
Inventory sold
last month
last month
417
Bright MLS | T3 Home Demand Index
www.homedemandindex.com
Washington D.C. | August 2025
Single Family Home $565k - $1360k
The index for mid-range single-family homes in Washington, D.C. dropped to 86 from 94 last month but remains well above last year’s 75. The month-over-month decrease reflects a short-term easing in buyer interest, while the year-over-year increase shows demand continues to outperform the prior year. Overall, the market maintains a relatively strong position despite the recent moderation.

Monthly Statistics for Single Family Home $565k - $1360k
Home Demand
Index
Index
86
(Slow)
Home Demand Index
from prior month
from prior month
94
Home Demand Index
from prior year
from prior year
75
Months of
Inventory
Inventory
2.2
Average daily inventory last month
2,720
Inventory sold
last month
last month
1,243
Bright MLS | T3 Home Demand Index
www.homedemandindex.com
Washington D.C. | August 2025
Single Family Home Above $1360k
The index for luxury single-family homes in Washington D.C. stands at 102 in the latest report, down from 129 last month but still above last year’s 93. The decrease compared to last month suggests a stabilization in buyer demand after recent fluctuations. However, the index remaining above the previous year points to ongoing solid interest in the luxury market. Overall, demand is steady, reflecting consistent buyer engagement at this price tier.

Monthly Statistics for Single Family Home Above $1360k
Home Demand
Index
Index
102
(Steady)
Home Demand Index
from prior month
from prior month
129
Home Demand Index
from prior year
from prior year
93
Months of
Inventory
Inventory
2.8
Average daily inventory last month
1,022
Inventory sold
last month
last month
361
Bright MLS | T3 Home Demand Index
www.homedemandindex.com
Washington D.C. | August 2025
Condo Below $595k
The index for entry-level condos in Washington D.C. is at 105, down from 115 last month but still above last year’s 100. The slight month-over-month decrease suggests demand is stabilizing in the short term, while the year-over-year growth reflects sustained interest in this segment. Overall, the market falls within the steady category for this latest report, with entry-level condos continuing to attract buyers.

Monthly Statistics for Condo Below $595k
Home Demand
Index
Index
105
(Steady)
Home Demand Index
from prior month
from prior month
115
Home Demand Index
from prior year
from prior year
100
Months of
Inventory
Inventory
3.7
Average daily inventory last month
2,579
Inventory sold
last month
last month
693
Bright MLS | T3 Home Demand Index
www.homedemandindex.com
Washington D.C. | August 2025
Condo Above $595k
The index for luxury condos in Washington D.C. for this latest report is 114, down from 131 last month but still above last year’s 110. The month-over-month decrease reflects a moderation in buyer interest, possibly influenced by shifting market conditions or buyer preferences. Despite this decline, buyer interest remains stronger than a year ago, indicating ongoing demand in the luxury condo segment.

Monthly Statistics for Condo Above $595k
Home Demand
Index
Index
114
(Moderate)
Home Demand Index
from prior month
from prior month
131
Home Demand Index
from prior year
from prior year
110
Months of
Inventory
Inventory
4.4
Average daily inventory last month
583
Inventory sold
last month
last month
132
Bright MLS | T3 Home Demand Index
www.homedemandindex.com
Washington D.C. | August 2025
Townhouse/Rowhouse/Twin All prices
Townhouse/
Rowhouse/Twin
All prices
Buyer demand for townhouses, rowhouses, and twins in Washington D.C. has softened, with the index falling to 89 from 96 last month. Although there is a noticeable slowdown in the short term, demand still exceeds last year’s level of 82, indicating sustained buyer interest. Despite this easing, attached homes remain appealing to buyers seeking an affordable option with more space.

Monthly Statistics for Townhouse/Rowhouse/TwinAll prices
Home Demand
Index
Index
89
(Slow)
Home Demand Index
from prior month
from prior month
96
Home Demand Index
from prior year
from prior year
82
Months of
Inventory
Inventory
2.6
Average daily inventory last month
3,394
Inventory sold
last month
last month
1,291
Bright MLS | T3 Home Demand Index
www.homedemandindex.com
Note
1. This report is generated with data from the following counties:
- Maryland-West Virginia Panhandle – Allegany, MD; Berkeley, WV; Garrett, MD; Grant, WV; Hampshire, WV; Hardy, WV; Jefferson, WV; Mineral, WV; Morgan, WV; Pendleton, WV; Washington, MD;
- North Central Virginia – Caroline, VA; Clarke, VA; Culpeper, VA; Fauquier, VA; Frederick, VA; Fredericksburg City, VA; King George, VA; Madison, VA; Manassas City, VA; Orange, VA; Page, VA; Prince William, VA; Rappahannock, VA; Shenandoah, VA; Spotsylvania, VA; Stafford, VA; Warren, VA; Winchester City, VA;
- Southern Maryland – Calvert, MD; Charles, MD; Saint Marys, MD;
- Washington D.C. Metro – Alexandria City, VA; Arlington, VA; Fairfax, VA; Falls Church City, VA; Frederick, MD; Loudoun, VA; Montgomery, MD; Prince Georges, MD; Washington, DC;
2. This report is for the August 2025 period with data collected from the previous month.
Released: August 9, 2025
Reference ID: 2287
Washington D.C. | August 2025
Home Demand Map (Zip Codes)
Buyer demand across the Washington D.C. region continues to show significant geographic variation. Core areas such as Arlington County and Alexandria City remain among the strongest performers, maintaining higher levels of buyer interest. Fairfax City, Fairfax, and Loudoun Counties are steady. In contrast, Frederick County falls into the limited category, while the remaining areas are experiencing slow demand.

Bright MLS | T3 Home Demand Index
www.homedemandindex.com