September 2025 Report
Philadelphia Metro
Philadelphia | September 2025
Home Demand Index
The Home Demand Index (HDI) for the Philadelphia metro area declined to 77 in the current report, down from 85 last month and slightly below the 81 recorded during the same period last year. This continued month-over-month softening suggests a seasonal cooling in buyer activity as the market transitions from summer into early fall. The year-over-year dip, though modest, points to slightly weaker demand conditions compared to last September, indicating a cautious buyer environment.
Buyer demand across most home segments in Philadelphia declined this period, though levels remain above last year in several categories. The index for entry-level single-family homes edged down from 83 to 81 but stayed higher than the 77 recorded last year, reflecting sustained slow interest. Meanwhile, mid-range single-family homes experienced a sharper pullback, with the index falling to 72 from 80 and below last year’s 78, suggesting affordability pressures are beginning to weigh more heavily in this tier. While some segments remain resilient, the overall market is showing signs of cooling amid ongoing inventory constraints and seasonal transition.

Monthly Statistics for September 2025
Home Demand
Index
Index
77
(Slow)
Home Demand Index
from prior month
from prior month
85
Home Demand Index
from prior year
from prior year
81
Index change
from prior month
from prior month
-9.4%
Index change from
same time last year
same time last year
-4.9%
Bright MLS | T3 Home Demand Index
www.homedemandindex.com
Philadelphia | September 2025
Home Demand Index | Historical Year-over-Year Comparison
This month’s HDI reading for Philadelphia is 77, reflecting a noticeable drop from 85 last month and a slight decrease compared to the 81 recorded during the same period last year. The year-over-year decline suggests a softening in market momentum, likely influenced by affordability constraints or broader economic caution. Over the past 12 months, HDI values have fluctuated within a moderate range, signaling a market that remains relatively steady but increasingly sensitive to short-term shifts.
Home Demand Index
Bright MLS | T3 Home Demand Index
www.homedemandindex.com
Philadelphia | September 2025
Home Demand Map
Buyer demand across the Philadelphia metro remains geographically uneven, with steady activity observed in core counties such as Bucks, Montgomery, New Castle, while Delaware, Philadelphia, and Chester counties are experiencing slow demand. Kent County continues to show moderate demand, supported by favorable inventory turnover and commuter accessibility. In contrast, demand remains limited in New Jersey counties and coastal areas such as Ocean County, reflecting cautious buyer sentiment in more discretionary or price-sensitive submarkets.
Bright MLS | T3 Home Demand Index
www.homedemandindex.com
Philadelphia | September 2025
Demand and Inventory by Home Type
Buyer demand across most home segments in Philadelphia declined this period, though levels remain above last year in several categories. The index for entry-level single-family homes edged down from 83 to 81 but stayed higher than the 77 recorded last year, reflecting sustained slow interest. Meanwhile, mid-range single-family homes experienced a sharper pullback, with the index falling to 72 from 80 and below last year’s 78, suggesting affordability pressures are beginning to weigh more heavily in this tier. While some segments remain resilient, the overall market is showing signs of cooling amid ongoing inventory constraints and seasonal transition.
Bright MLS | T3 Home Demand Index
www.homedemandindex.com
Philadelphia | September 2025
Single Family Home Below $355k
The index for entry-level single-family homes in Philadelphia stands at 81 this month, down slightly from 83 last month. This modest decline indicates that demand in this segment is now slow, consistent with seasonal trends. Although the index remains above last year’s level of 77, buyer activity has slowed, likely due to affordability pressures that continue to shape the market.

Monthly Statistics for Single Family Home Below $355k
Home Demand
Index
Index
81
(Slow)
Home Demand Index
from prior month
from prior month
83
Home Demand Index
from prior year
from prior year
77
Months of
inventory
inventory
2.2
Average daily inventory last month
1,321
Inventory sold
last month
last month
604
Bright MLS | T3 Home Demand Index
www.homedemandindex.com
Philadelphia | September 2025
Single Family Home $355k - $794k
The index for mid-range single-family homes in Philadelphia declined to 72, down from 80 last month and below the 78 reported during the same period last year. This back-to-back decline reflects a softening trend in buyer activity, likely driven by affordability constraints and reduced purchasing power in the mid-market tier. The shift suggests that demand is beginning to weaken more notably in this segment, with buyers showing increasing sensitivity to price and financing conditions.

Monthly Statistics for Single Family Home $355k - $794k
Home Demand
Index
Index
72
(Slow)
Home Demand Index
from prior month
from prior month
80
Home Demand Index
from prior year
from prior year
78
Months of
Inventory
Inventory
1.8
Average daily inventory last month
3,401
Inventory sold
last month
last month
1,887
Bright MLS | T3 Home Demand Index
www.homedemandindex.com
Philadelphia | September 2025
Single Family Home Above $794k
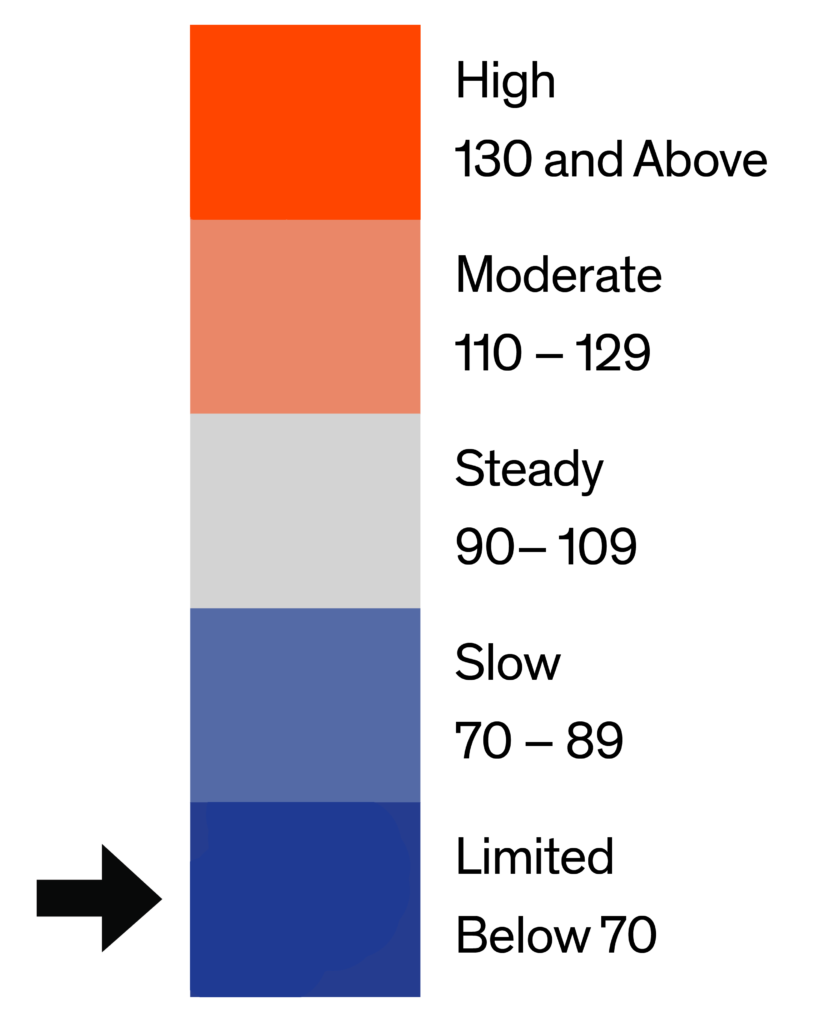
The index for luxury single-family homes in Philadelphia decreased to 58 this month, down from 71 last month and below last year’s level of 66. This consistent downward trend points to waning buyer interest in the high-end market, possibly influenced by ongoing affordability challenges or a shift in investment priorities. The year-over-year decline reinforces the notion that luxury demand is softening, even as inventory in this segment remains limited.

Monthly Statistics for Single Family Home Above $794k
Home Demand
Index
Index
58
(Limited)
Home Demand Index
from prior month
from prior month
71
Home Demand Index
from prior year
from prior year
66
Months of
Inventory
Inventory
2.1
Average daily inventory last month
1,241
Inventory sold
last month
last month
605
Bright MLS | T3 Home Demand Index
www.homedemandindex.com
Philadelphia | September 2025
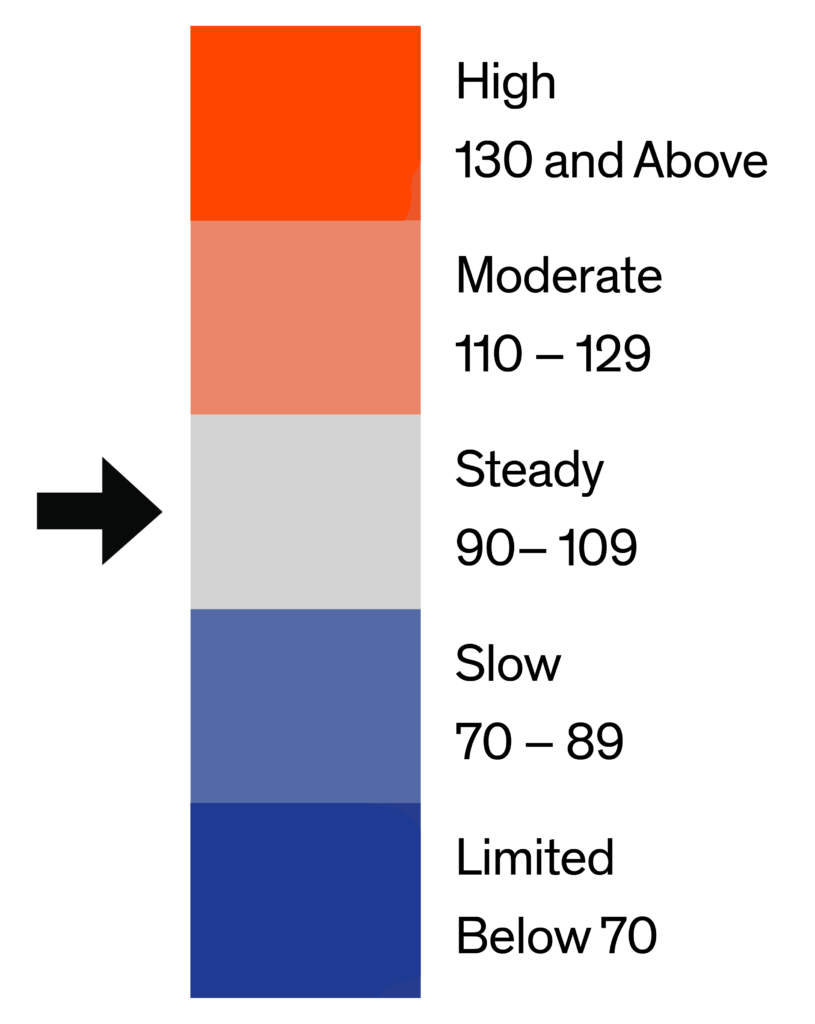
Condo Below $425k
The index for entry-level condos in Philadelphia rose slightly to 97 this month, up from 96 last month and notably higher than the 88 recorded one year ago. This modest month-over-month increase reflects stable buyer interest, while the year-over-year gain signals continued strength in this more affordable segment. Entry-level condos remain attractive to cost-conscious buyers navigating a market constrained by rising prices and limited inventory.

Monthly Statistics for Condo Below $425k
Home Demand
Index
Index
97
(Steady)
Home Demand Index
from prior month
from prior month
96
Home Demand Index
from prior year
from prior year
88
Months of
Inventory
Inventory
3.9
Average daily inventory last month
1,072
Inventory sold
last month
last month
273
Bright MLS | T3 Home Demand Index
www.homedemandindex.com
Philadelphia | September 2025
Condo Above $425k
The index for luxury condos in Philadelphia stands at 101 this month, down from 107 last month but up from last year’s level of 92. The month-over-month decline suggests softening buyer interest in the high-end condo market, though demand remains stronger than it was a year ago. This continued year-over-year growth highlights resilience in the luxury segment, despite recent signs of short-term moderation.

Monthly Statistics for Condo Above $425k
Home Demand
Index
Index
101
(Steady)
Home Demand Index
from prior month
from prior month
107
Home Demand Index
from prior year
from prior year
92
Months of
Inventory
Inventory
6.5
Average daily inventory last month
298
Inventory sold
last month
last month
46
Bright MLS | T3 Home Demand Index
www.homedemandindex.com
Philadelphia | September 2025
Townhouse/Rowhouse/Twin All prices
Townhouse/
Rowhouse/Twin
All prices
The index for townhouses, rowhouses, and twins in Philadelphia declined to 84 this month, down from 91 last month and slightly below last year’s level of 88. This softening trend reflects a decrease in short-term buyer interest, possibly due to seasonal factors or tighter financing conditions. Still, demand in this segment remains relatively steady, supported by buyer preferences for affordable homes that offer more space than condos.

Monthly Statistics for Townhouse/Rowhouse/TwinAll prices
Home Demand
Index
Index
84
(Slow)
Home Demand Index
from prior month
from prior month
91
Home Demand Index
from prior year
from prior year
88
Months of
Inventory
Inventory
3.4
Average daily inventory last month
6,619
Inventory sold
last month
last month
1,956
Bright MLS | T3 Home Demand Index
www.homedemandindex.com
Note
1. This report is generated with data from the following counties:
- Central Pennsylvania – Adams, PA; Berks, PA; Cumberland, PA; Dauphin, PA; Franklin, PA; Fulton, PA; Lancaster, PA; Lebanon, PA; Perry, PA; Schuylkill, PA; York, PA;
- Ocean County – Ocean, NJ;
- Philadelphia Metro – Bucks, PA; Burlington, NJ; Camden, NJ; Chester, PA; Delaware, PA; Gloucester, NJ; Kent, DE; Mercer, NJ; Montgomery, PA; New Castle, DE; Philadelphia, PA;
- Salem-Cumberland – Cumberland, NJ; Salem, NJ;
2. This report is for the September 2025 period with data collected from the previous month.
Released: September 11, 2025
Reference ID: 2301
Philadelphia | September 2025
Home Demand Map (Zip Codes)
Buyer demand across the Philadelphia metro remains geographically uneven, with steady activity observed in core counties such as Bucks, Montgomery, New Castle, while Delaware, Philadelphia, and Chester counties are experiencing slow demand. Kent County continues to show moderate demand, supported by favorable inventory turnover and commuter accessibility. In contrast, demand remains limited in New Jersey counties and coastal areas such as Ocean County, reflecting cautious buyer sentiment in more discretionary or price-sensitive submarkets.

Bright MLS | T3 Home Demand Index
www.homedemandindex.com