May 2025 Report
Philadelphia Metro
Philadelphia | May 2025
Home Demand Index
The Home Demand Index (HDI) for Philadelphia this report period stands at 89, reflecting an increase from last month’s 87 but slightly below last year’s 90. This improvement suggests strengthening buyer interest, potentially driven by seasonal factors or economic stabilization. However, the slight year-over-year decline highlights ongoing affordability concerns.
Demand for entry-level single-family homes in Philadelphia decreased slightly to 80, down from 86 last month but similar to last year’s 79, indicating sustained interest despite affordability constraints. Mid-range single-family homes saw modest growth, with the index reaching 79, up from last month’s 76, though below last year’s 86. Luxury single-family homes experienced a notable rise to 87, matching last year’s figure, suggesting continued strong buyer interest in high-end properties.

Monthly Statistics for May 2025
Home Demand
Index
Index
89
(Slow)
Home Demand Index
from prior month
from prior month
87
Home Demand Index
from prior year
from prior year
90
Index change
from prior month
from prior month
2.3%
Index change from
same time last year
same time last year
-1.1%
Bright MLS | T3 Home Demand Index
www.homedemandindex.com
Philadelphia | May 2025
Home Demand Index | Historical Year-over-Year Comparison
The year-over-year comparison for Philadelphia’s HDI shows a slight decrease from 90 last year to 89 in this report period. This minor decline indicates stable market conditions, with demand remaining relatively consistent. Market dynamics are influenced by affordability and inventory availability.
Home Demand Index
Bright MLS | T3 Home Demand Index
www.homedemandindex.com
Philadelphia | May 2025
Home Demand Map
Buyer interest across the Philadelphia region remains varied. Urban areas such as Center City and parts of Montgomery and Bucks counties are experiencing steady demand. In contrast, New Jersey counties continue to show limited demand. Coastal areas like Ocean County also reflect limited buyer interest, highlighting ongoing disparities across the region.
Bright MLS | T3 Home Demand Index
www.homedemandindex.com
Philadelphia | May 2025
Demand and Inventory by Home Type
Demand for entry-level single-family homes in Philadelphia decreased slightly to 80, down from 86 last month but similar to last year’s 79, indicating sustained interest despite affordability constraints. Mid-range single-family homes saw modest growth, with the index reaching 79, up from last month’s 76, though below last year’s 86. Luxury single-family homes experienced a notable rise to 87, matching last year’s figure, suggesting continued strong buyer interest in high-end properties.
Bright MLS | T3 Home Demand Index
www.homedemandindex.com
Philadelphia | May 2025
Single Family Home Below $350k
The index for entry-level single-family homes in Philadelphia stands at 80, a slight decrease from last month’s 86 but consistent with last year’s 79. This decline suggests a slight cooling in demand, potentially influenced by affordability challenges. Inventory remains constrained, maintaining competitive market conditions.

Monthly Statistics for Single Family Home Below $350k
Home Demand
Index
Index
80
(Slow)
Home Demand Index
from prior month
from prior month
86
Home Demand Index
from prior year
from prior year
79
Months of
inventory
inventory
2.1
Average daily inventory last month
1,068
Inventory sold
last month
last month
505
Bright MLS | T3 Home Demand Index
www.homedemandindex.com
Philadelphia | May 2025
Single Family Home $350k - $770k
The index for mid-range single-family homes in Philadelphia is 79, up from last month’s 76 but below last year’s 86. This slight month-over-month rise reflects stable buyer interest, though the year-over-year decline suggests a softening in demand. Limited inventory continues to influence this segment.

Monthly Statistics for Single Family Home $350k - $770k
Home Demand
Index
Index
79
(Slow)
Home Demand Index
from prior month
from prior month
76
Home Demand Index
from prior year
from prior year
86
Months of
Inventory
Inventory
1.8
Average daily inventory last month
2,493
Inventory sold
last month
last month
1,378
Bright MLS | T3 Home Demand Index
www.homedemandindex.com
Philadelphia | May 2025
Single Family Home Above $770k
The index for luxury single-family homes in Philadelphia stands at 87, showing a strong recovery from last month’s 73 and matching last year’s 87. This increase suggests renewed interest in the high-end market, potentially driven by improved economic conditions. The consistent year-over-year figure highlights steady demand in this segment.

Monthly Statistics for Single Family Home Above $770k
Home Demand
Index
Index
87
(Slow)
Home Demand Index
from prior month
from prior month
73
Home Demand Index
from prior year
from prior year
87
Months of
Inventory
Inventory
2.9
Average daily inventory last month
1,052
Inventory sold
last month
last month
367
Bright MLS | T3 Home Demand Index
www.homedemandindex.com
Philadelphia | May 2025
Condo Below $415k
The index for entry-level condos in Philadelphia stands at 115, nearly unchanged from last month’s 116 but significantly higher than last year’s 101. This stability indicates continued strong demand for affordable condo options. The sustained year-over-year increase underscores the resilience of this segment.

Monthly Statistics for Condo Below $415k
Home Demand
Index
Index
115
(Moderate)
Home Demand Index
from prior month
from prior month
116
Home Demand Index
from prior year
from prior year
101
Months of
Inventory
Inventory
4.4
Average daily inventory last month
1,067
Inventory sold
last month
last month
243
Bright MLS | T3 Home Demand Index
www.homedemandindex.com
Philadelphia | May 2025
Condo Above $415k
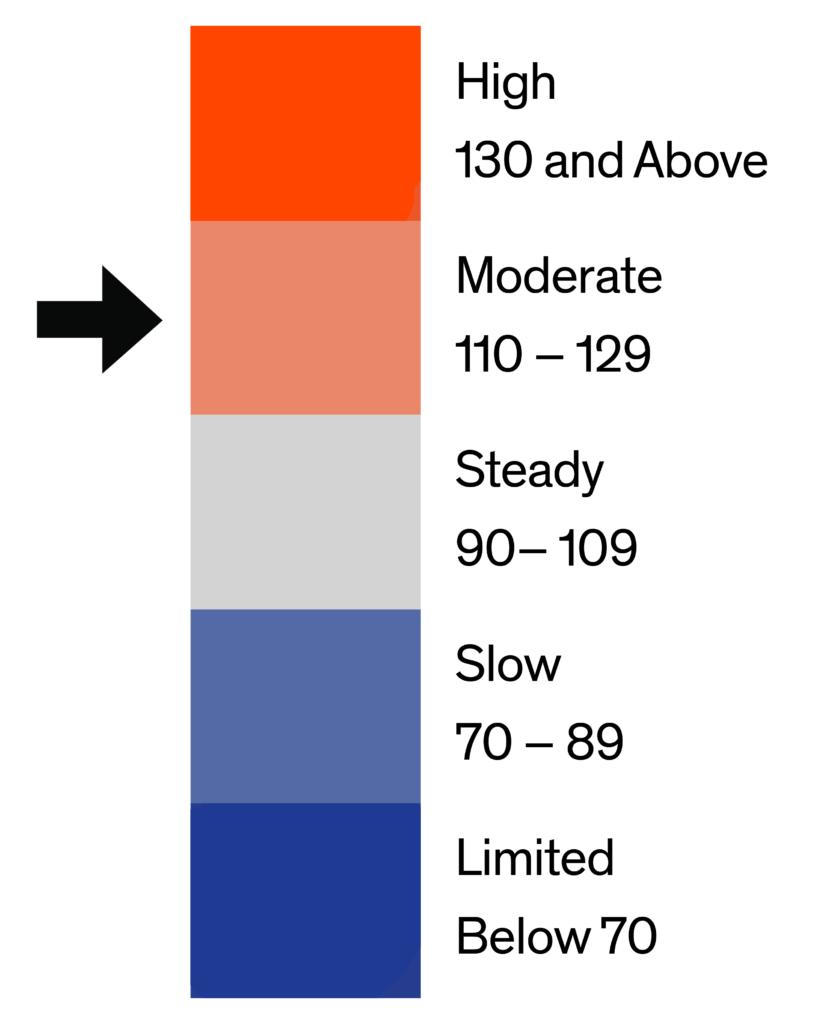
The index for luxury condos in Philadelphia stands at 124, down slightly from last month’s 129 and below last year’s 132. This decline suggests a modest cooling in high-end buyer interest, likely influenced by affordability or market adjustments. However, demand remains robust, reflecting ongoing buyer engagement in the luxury segment.

Monthly Statistics for Condo Above $415k
Home Demand
Index
Index
124
(Moderate)
Home Demand Index
from prior month
from prior month
129
Home Demand Index
from prior year
from prior year
132
Months of
Inventory
Inventory
5.4
Average daily inventory last month
298
Inventory sold
last month
last month
55
Bright MLS | T3 Home Demand Index
www.homedemandindex.com
Philadelphia | May 2025
Townhouse/Rowhouse/Twin All prices
Townhouse/
Rowhouse/Twin
All prices
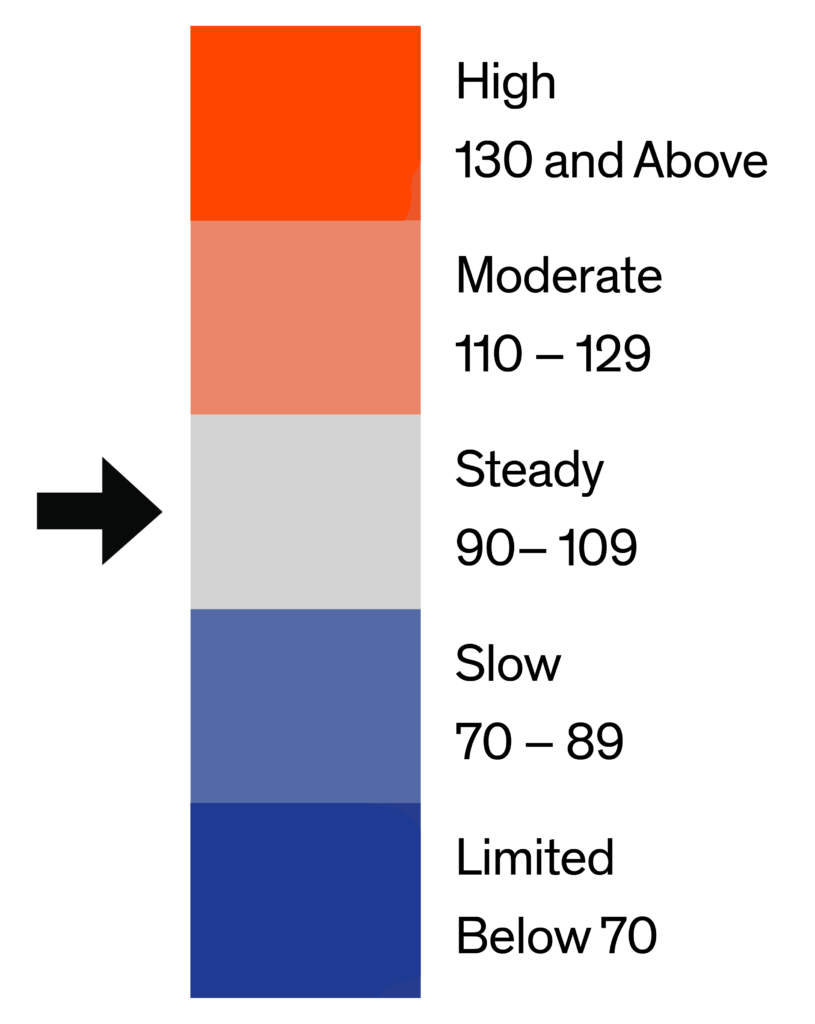
The index for townhouses, rowhouses, and twins in Philadelphia is 99, consistent with last month and slightly above last year’s 96. This stability suggests steady buyer interest, with continued demand for attached homes in the region. Limited inventory continues to support competitive market conditions.

Monthly Statistics for Townhouse/Rowhouse/TwinAll prices
Home Demand
Index
Index
99
(Steady)
Home Demand Index
from prior month
from prior month
99
Home Demand Index
from prior year
from prior year
96
Months of
Inventory
Inventory
3.4
Average daily inventory last month
5,992
Inventory sold
last month
last month
1,774
Bright MLS | T3 Home Demand Index
www.homedemandindex.com
Note
1. This report is generated with data from the following counties:
- Central Pennsylvania – Adams, PA; Berks, PA; Cumberland, PA; Dauphin, PA; Franklin, PA; Fulton, PA; Lancaster, PA; Lebanon, PA; Perry, PA; Schuylkill, PA; York, PA;
- Ocean County – Ocean, NJ;
- Philadelphia Metro – Bucks, PA; Burlington, NJ; Camden, NJ; Chester, PA; Delaware, PA; Gloucester, NJ; Kent, DE; Mercer, NJ; Montgomery, PA; New Castle, DE; Philadelphia, PA;
- Salem-Cumberland – Cumberland, NJ; Salem, NJ;
2. This report is for the May 2025 period with data collected from the previous month.
Released: May 9, 2025
Reference ID: 2240
Philadelphia | May 2025
Home Demand Map (Zip Codes)
Buyer interest across the Philadelphia region remains varied. Urban areas such as Center City and parts of Montgomery and Bucks counties are experiencing steady demand. In contrast, New Jersey counties continue to show limited demand. Coastal areas like Ocean County also reflect limited buyer interest, highlighting ongoing disparities across the region.

Bright MLS | T3 Home Demand Index
www.homedemandindex.com