June 2025 Report
Philadelphia Metro
Philadelphia | June 2025
Home Demand Index
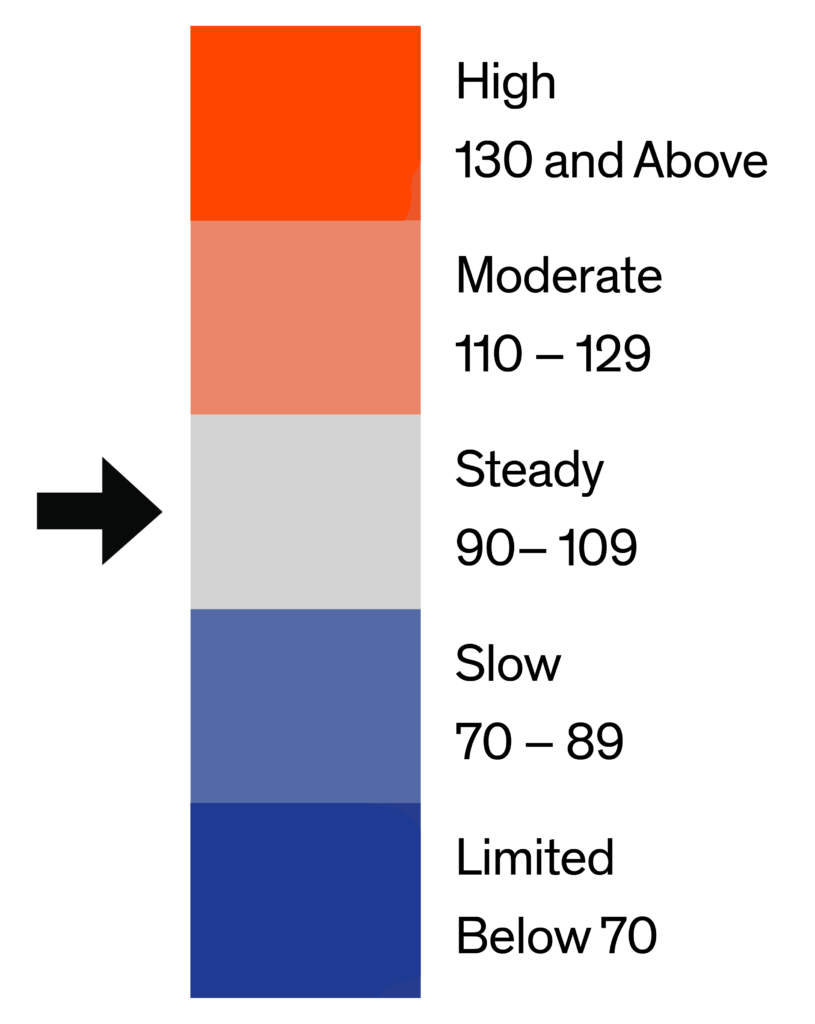
The Home Demand Index (HDI) for the Philadelphia metro area stands at 90 this month, down slightly from 91 in the previous month but up from 87 during the same period last year. The current reading places the market in the Steady demand category, indicating relatively stable buyer activity. The minor month-over-month dip may reflect typical seasonal slowing, combined with ongoing affordability challenges and limited inventory. Despite this modest softening, the market remains broadly balanced, with consistent buyer engagement across much of the metro area.
Property type trends across the Philadelphia metro indicate selective buyer activity. Entry-level single-family homes (under $350,000) dipped to an index of 82, down from 84 last month but up from 75 a year ago, reflecting continued affordability challenges. Mid-range single-family homes ($350,000–$765,000) posted an index of 84, slightly up from 81 last month but below 85 last year, suggesting relatively steady but soft demand. Luxury single-family homes priced over $765,000 increased to 93 from 88 last month. This figure remains above last year’s 89, indicating stable interest among affluent buyers. Entry-level condos (under $420,000) declined to 106 from 118 last month, though demand remains stronger than last year’s 98, showing ongoing interest in affordable attached options. Luxury condos (above $420,000) reached 120, which is down from 125 last month and also lower than last year’s figure. This indicates a cooling or softening demand in the upscale condo market. Townhouses, rowhouses, and twins across all price points fell to 95 from 101 last month but are up slightly from 90 a year ago, reflecting steady but softening demand.

Monthly Statistics for June 2025
Home Demand
Index
Index
90
(Steady)
Home Demand Index
from prior month
from prior month
91
Home Demand Index
from prior year
from prior year
87
Index change
from prior month
from prior month
-1.1%
Index change from
same time last year
same time last year
3.4%
Bright MLS | T3 Home Demand Index
www.homedemandindex.com
Philadelphia | June 2025
Home Demand Index | Historical Year-over-Year Comparison
This month’s HDI reading of 90 marks a modest increase from the 87 recorded during the same period last year. The index reached a recent peak of 91 last month before dipping slightly to its current level, suggesting a typical seasonal slowdown. Over the past 12 months, the Philadelphia market has shown relative stability, with HDI values fluctuating within a narrow range. This consistency highlights the market’s resilience despite broader economic uncertainty.
Home Demand Index
Bright MLS | T3 Home Demand Index
www.homedemandindex.com
Philadelphia | June 2025
Home Demand Map
Buyer interest across the Philadelphia region continues to vary by submarket. Core areas such as Center City and parts of Montgomery, Bucks, and Chester counties are seeing moderate demand, driven by sustained interest in well-located properties. In contrast, New Jersey counties remain in the limited demand category. Along the coast, Ocean County continues to show limited demand, indicating that buyer focus may be shifting away from second-home markets or areas more sensitive to pricing.
Bright MLS | T3 Home Demand Index
www.homedemandindex.com
Philadelphia | June 2025
Demand and Inventory by Home Type
Property type trends across the Philadelphia metro indicate selective buyer activity. Entry-level single-family homes (under $350,000) dipped to an index of 82, down from 84 last month but up from 75 a year ago, reflecting continued affordability challenges. Mid-range single-family homes ($350,000–$765,000) posted an index of 84, slightly up from 81 last month but below 85 last year, suggesting relatively steady but soft demand. Luxury single-family homes priced over $765,000 increased to 93 from 88 last month. This figure remains above last year’s 89, indicating stable interest among affluent buyers. Entry-level condos (under $420,000) declined to 106 from 118 last month, though demand remains stronger than last year’s 98, showing ongoing interest in affordable attached options. Luxury condos (above $420,000) reached 120, which is down from 125 last month and also lower than last year’s figure. This indicates a cooling or softening demand in the upscale condo market. Townhouses, rowhouses, and twins across all price points fell to 95 from 101 last month but are up slightly from 90 a year ago, reflecting steady but softening demand.
Bright MLS | T3 Home Demand Index
www.homedemandindex.com
Philadelphia | June 2025
Single Family Home Below $350k
The HDI for entry-level single-family homes in the Philadelphia metro fell to 82 this month, a slight drop from 84 last month.This is higher than the 75 recorded one year ago. This segment remains in the Slow demand category and continues to feel the effects of affordability constraints and limited supply. Despite this, structural demand persists, particularly among first-time buyers looking for accessibly priced homes.

Monthly Statistics for Single Family Home Below $350k
Home Demand
Index
Index
82
(Slow)
Home Demand Index
from prior month
from prior month
84
Home Demand Index
from prior year
from prior year
75
Months of
inventory
inventory
1.9
Average daily inventory last month
1,132
Inventory sold
last month
last month
588
Bright MLS | T3 Home Demand Index
www.homedemandindex.com
Philadelphia | June 2025
Single Family Home $350k - $765k
Demand for mid-priced single-family homes declined to 84 this month, down from 81 the previous month and 85 one year ago. This places the segment in the slow demand category. The slight monthly pullback may reflect seasonal factors or limited attractive inventory, particularly for move-up buyers. While buyer interest in this segment has dipped slightly compared to last year, the decline has been modest.

Monthly Statistics for Single Family Home $350k - $765k
Home Demand
Index
Index
84
(Slow)
Home Demand Index
from prior month
from prior month
81
Home Demand Index
from prior year
from prior year
85
Months of
Inventory
Inventory
1.9
Average daily inventory last month
3,000
Inventory sold
last month
last month
1,620
Bright MLS | T3 Home Demand Index
www.homedemandindex.com
Philadelphia | June 2025
Single Family Home Above $765k
Luxury single-family homes in the Philadelphia area posted a Home Demand Index of 93 this month, a slight increase from 88 in the prior month, and also above the 89 seen a year ago. This segment remains within the Steady Demand category and continues to attract affluent buyers, likely benefiting from cash transactions and more flexible purchasing timelines. The slight increase is not unusual for this time of year.

Monthly Statistics for Single Family Home Above $765k
Home Demand
Index
Index
93
(Steady)
Home Demand Index
from prior month
from prior month
88
Home Demand Index
from prior year
from prior year
89
Months of
Inventory
Inventory
2.8
Average daily inventory last month
1,322
Inventory sold
last month
last month
477
Bright MLS | T3 Home Demand Index
www.homedemandindex.com
Philadelphia | June 2025
Condo Below $420k
The entry-level condo segment posted a strong reading of 106, though this is down from 118 last month. Still, demand remains firmly in the High category and is significantly stronger than the 98 recorded one year ago. These properties offer a more affordable path to homeownership, which continues to resonate with cost-conscious buyers in a high-rate environment.

Monthly Statistics for Condo Below $420k
Home Demand
Index
Index
106
(Steady)
Home Demand Index
from prior month
from prior month
118
Home Demand Index
from prior year
from prior year
98
Months of
Inventory
Inventory
3.8
Average daily inventory last month
1,114
Inventory sold
last month
last month
295
Bright MLS | T3 Home Demand Index
www.homedemandindex.com
Philadelphia | June 2025
Condo Above $420k
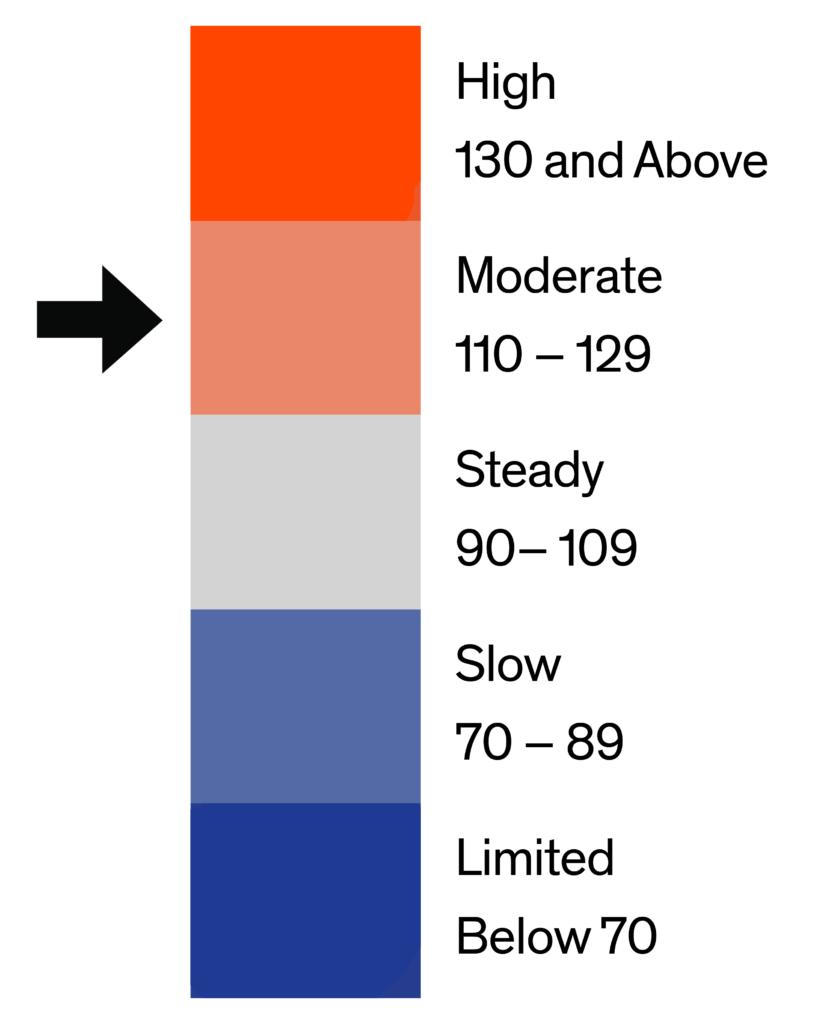
Luxury condos surged to an index of 120, the highest among all segments this month. This marks a slight decrease from 125 in the prior month and from 125 one year ago. Demand in this category remains Very High, driven by affluent buyers seeking convenience, location, and lifestyle amenities. The segment continues to outperform, even as other parts of the market soften.

Monthly Statistics for Condo Above $420k
Home Demand
Index
Index
120
(Moderate)
Home Demand Index
from prior month
from prior month
125
Home Demand Index
from prior year
from prior year
125
Months of
Inventory
Inventory
5.1
Average daily inventory last month
322
Inventory sold
last month
last month
63
Bright MLS | T3 Home Demand Index
www.homedemandindex.com
Philadelphia | June 2025
Townhouse/Rowhouse/Twin All prices
Townhouse/
Rowhouse/Twin
All prices
The index for townhouses, rowhouses, and twins in the Philadelphia metro area currently stands at 95 this month. This is a slight decrease from last month’s 101, yet it’s up from the 90 recorded one year ago. Demand for these properties remains in the Steady range, continuing to appeal to buyers looking for affordability and desirable locations. However, competition from other housing types and broader affordability limitations appear to be tempering some of the market’s recent growth.

Monthly Statistics for Townhouse/Rowhouse/TwinAll prices
Home Demand
Index
Index
95
(Steady)
Home Demand Index
from prior month
from prior month
101
Home Demand Index
from prior year
from prior year
90
Months of
Inventory
Inventory
3.1
Average daily inventory last month
6,359
Inventory sold
last month
last month
2,079
Bright MLS | T3 Home Demand Index
www.homedemandindex.com
Note
1. This report is generated with data from the following counties:
- Central Pennsylvania – Adams, PA; Berks, PA; Cumberland, PA; Dauphin, PA; Franklin, PA; Fulton, PA; Lancaster, PA; Lebanon, PA; Perry, PA; Schuylkill, PA; York, PA;
- Ocean County – Ocean, NJ;
- Philadelphia Metro – Bucks, PA; Burlington, NJ; Camden, NJ; Chester, PA; Delaware, PA; Gloucester, NJ; Kent, DE; Mercer, NJ; Montgomery, PA; New Castle, DE; Philadelphia, PA;
- Salem-Cumberland – Cumberland, NJ; Salem, NJ;
2. This report is for the June 2025 period with data collected from the previous month.
Released: June 10, 2025
Reference ID: 2255
Philadelphia | June 2025
Home Demand Map (Zip Codes)
Buyer interest across the Philadelphia region continues to vary by submarket. Core areas such as Center City and parts of Montgomery, Bucks, and Chester counties are seeing moderate demand, driven by sustained interest in well-located properties. In contrast, New Jersey counties remain in the limited demand category. Along the coast, Ocean County continues to show limited demand, indicating that buyer focus may be shifting away from second-home markets or areas more sensitive to pricing.

Bright MLS | T3 Home Demand Index
www.homedemandindex.com