April 2025 Report
Philadelphia Metro
Philadelphia | April 2025
Home Demand Index
The Home Demand Index (HDI) for Philadelphia is 86, reflecting an increase from last month’s 72 but nearly unchanged from last year’s 85. This month-over-month improvement indicates growing buyer interest, potentially driven by seasonal demand or economic stabilization. However, the slight year-over-year decrease suggests that demand remains somewhat restrained compared to the previous year.
Demand for entry-level single-family homes increased to 84, up from 81 last year, suggesting heightened interest as buyers seek more affordable housing options. The luxury single-family segment saw a significant rise to 71, up from 52 last month, indicating a surge in buyer interest or potential adjustments in inventory levels. This shift highlights the dynamic market conditions across various price tiers.

Monthly Statistics for April 2025
Home Demand
Index
Index
86
(Slow)
Home Demand Index
from prior month
from prior month
72
Home Demand Index
from prior year
from prior year
85
Index change
from prior month
from prior month
19.4%
Index change from
same time last year
same time last year
1.2%
Bright MLS | T3 Home Demand Index
www.homedemandindex.com
Philadelphia | April 2025
Home Demand Index | Historical Year-over-Year Comparison
The year-over-year comparison for Philadelphia’s HDI shows a slight decline from 85 last year to 86 in this report period. This minimal change suggests relatively stable market conditions over the past year, despite some fluctuations. The steady index points to consistent buyer engagement, although broader economic challenges may still be influencing overall demand.
Home Demand Index
Bright MLS | T3 Home Demand Index
www.homedemandindex.com
Philadelphia | April 2025
Home Demand Map
Buyer interest across the Philadelphia region is varied, with stronger demand observed in urban and high-density suburban areas. Key markets, such as Center City and parts of Montgomery and Bucks counties, have shown increased activity, moving from slow to steady demand. However, some suburban and rural areas remain categorized as limited or slow, reflecting continued disparities in buyer engagement across the region.
Bright MLS | T3 Home Demand Index
www.homedemandindex.com
Philadelphia | April 2025
Demand and Inventory by Home Type
Demand for entry-level single-family homes increased to 84, up from 81 last year, suggesting heightened interest as buyers seek more affordable housing options. The luxury single-family segment saw a significant rise to 71, up from 52 last month, indicating a surge in buyer interest or potential adjustments in inventory levels. This shift highlights the dynamic market conditions across various price tiers.
Bright MLS | T3 Home Demand Index
www.homedemandindex.com
Philadelphia | April 2025
Single Family Home Below $350k
The index for entry-level single-family homes is 84, up from last month’s 72 but slightly above last year’s 81. This month-over-month increase indicates a moderate rise in buyer interest, though demand remains relatively stable compared to last year. The ongoing affordability challenges continue to influence buyer activity in this segment, despite recent improvements.

Monthly Statistics for Single Family Home Below $350k
Home Demand
Index
Index
84
(Slow)
Home Demand Index
from prior month
from prior month
72
Home Demand Index
from prior year
from prior year
81
Months of
inventory
inventory
2.2
Average daily inventory last month
1,007
Inventory sold
last month
last month
463
Bright MLS | T3 Home Demand Index
www.homedemandindex.com
Philadelphia | April 2025
Single Family Home $350k - $765k
The index for mid-range single-family homes is 74, showing an increase from last month’s 60 but remaining close to last year’s 75. The month-over-month improvement suggests a modest recovery in buyer interest, although demand remains largely unchanged compared to the same period last year. The stability in this segment highlights consistent buyer engagement despite broader economic fluctuations.

Monthly Statistics for Single Family Home $350k - $765k
Home Demand
Index
Index
74
(Slow)
Home Demand Index
from prior month
from prior month
60
Home Demand Index
from prior year
from prior year
75
Months of
Inventory
Inventory
1.9
Average daily inventory last month
2,234
Inventory sold
last month
last month
1,170
Bright MLS | T3 Home Demand Index
www.homedemandindex.com
Philadelphia | April 2025
Single Family Home Above $765k
The index for luxury single-family homes is 71, up from last month’s 52 and matching last year’s 71. The month-over-month increase suggests a significant rebound in buyer interest, possibly driven by market adjustments or renewed confidence in the high-end segment. The consistent year-over-year figure indicates steady demand in the luxury market, despite economic uncertainties.

Monthly Statistics for Single Family Home Above $765k
Home Demand
Index
Index
71
(Slow)
Home Demand Index
from prior month
from prior month
52
Home Demand Index
from prior year
from prior year
71
Months of
Inventory
Inventory
3.4
Average daily inventory last month
812
Inventory sold
last month
last month
242
Bright MLS | T3 Home Demand Index
www.homedemandindex.com
Philadelphia | April 2025
Condo Below $415k
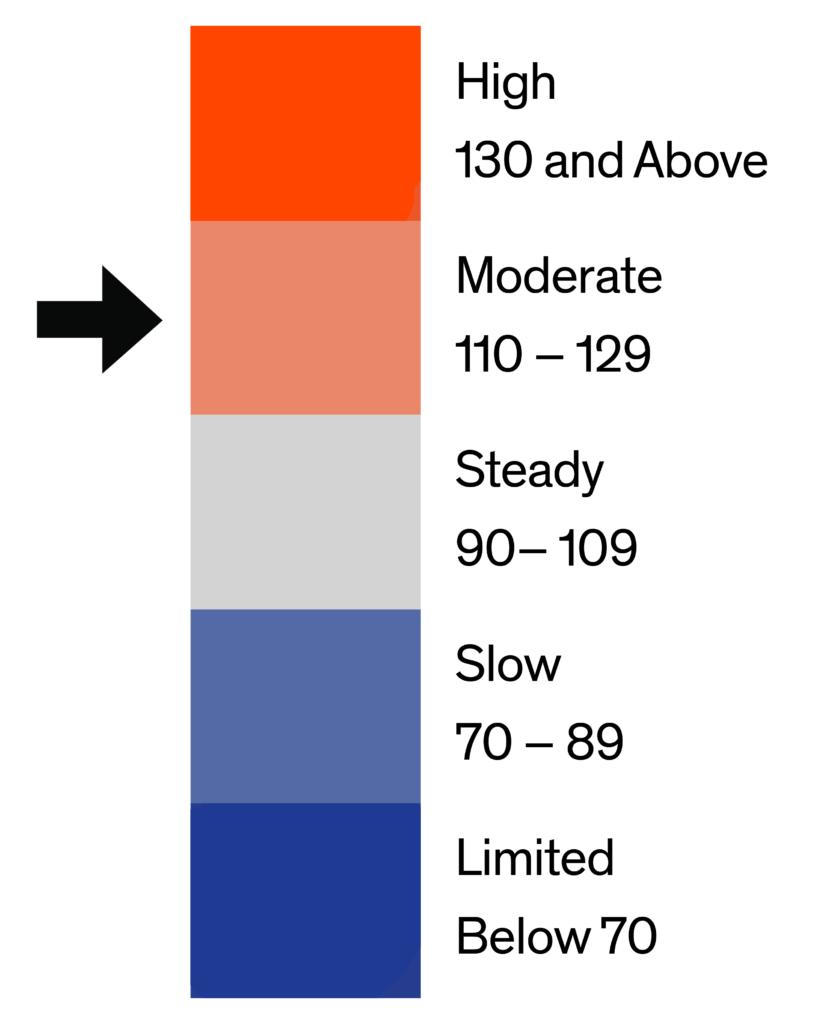
The index for entry-level condos is 113, showing an increase from last month’s 98 and last year’s 96. The rise indicates growing buyer interest in affordable condos, likely driven by improving market conditions or greater availability of options. The sustained year-over-year improvement underscores the resilience of this segment amid broader economic challenges.

Monthly Statistics for Condo Below $415k
Home Demand
Index
Index
113
(Moderate)
Home Demand Index
from prior month
from prior month
98
Home Demand Index
from prior year
from prior year
96
Months of
Inventory
Inventory
4.1
Average daily inventory last month
898
Inventory sold
last month
last month
221
Bright MLS | T3 Home Demand Index
www.homedemandindex.com
Philadelphia | April 2025
Condo Above $415k
The luxury condo index has surged to 127, up from last month’s 121, but still slightly lower than last year’s 133. This growth reflects heightened buyer interest, possibly driven by favorable economic conditions or seasonal demand. The continued improvement indicates strong interest from buyers and investors in the luxury segment.

Monthly Statistics for Condo Above $415k
Home Demand
Index
Index
127
(Moderate)
Home Demand Index
from prior month
from prior month
121
Home Demand Index
from prior year
from prior year
133
Months of
Inventory
Inventory
6.1
Average daily inventory last month
282
Inventory sold
last month
last month
46
Bright MLS | T3 Home Demand Index
www.homedemandindex.com
Philadelphia | April 2025
Townhouse/Rowhouse/Twin All prices
Townhouse/
Rowhouse/Twin
All prices
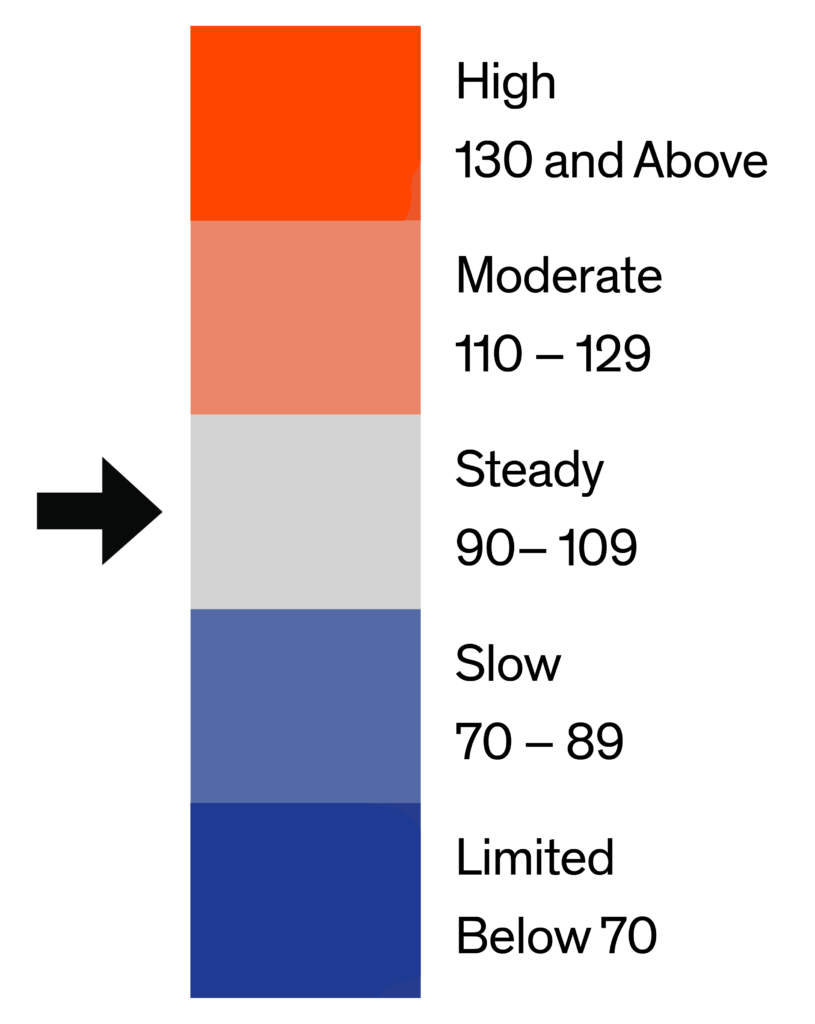
The index for townhouses, rowhouses, and twins is 97, up from last month’s 86 and identical to last year’s 97. The month-over-month improvement indicates a rebound in buyer interest, while the steady year-over-year figure suggests consistent demand despite affordability challenges. Limited inventory and sustained buyer preferences for attached homes continue to support this segment.

Monthly Statistics for Townhouse/Rowhouse/TwinAll prices
Home Demand
Index
Index
97
(Steady)
Home Demand Index
from prior month
from prior month
86
Home Demand Index
from prior year
from prior year
97
Months of
Inventory
Inventory
3.3
Average daily inventory last month
5,635
Inventory sold
last month
last month
1,698
Bright MLS | T3 Home Demand Index
www.homedemandindex.com
Note
1. This report is generated with data from the following counties:
- Central Pennsylvania – Adams, PA; Berks, PA; Cumberland, PA; Dauphin, PA; Franklin, PA; Fulton, PA; Lancaster, PA; Lebanon, PA; Perry, PA; Schuylkill, PA; York, PA;
- Ocean County – Ocean, NJ;
- Philadelphia Metro – Bucks, PA; Burlington, NJ; Camden, NJ; Chester, PA; Delaware, PA; Gloucester, NJ; Kent, DE; Mercer, NJ; Montgomery, PA; New Castle, DE; Philadelphia, PA;
- Salem-Cumberland – Cumberland, NJ; Salem, NJ;
2. This report is for the April 2025 period with data collected from the previous month.
Released: April 10, 2025
Reference ID: 2224
Philadelphia | April 2025
Home Demand Map (Zip Codes)
Buyer interest across the Philadelphia region is varied, with stronger demand observed in urban and high-density suburban areas. Key markets, such as Center City and parts of Montgomery and Bucks counties, have shown increased activity, moving from slow to steady demand. However, some suburban and rural areas remain categorized as limited or slow, reflecting continued disparities in buyer engagement across the region.

Bright MLS | T3 Home Demand Index
www.homedemandindex.com