September 2025 Report
Baltimore Metro
Baltimore | September 2025
Home Demand Index
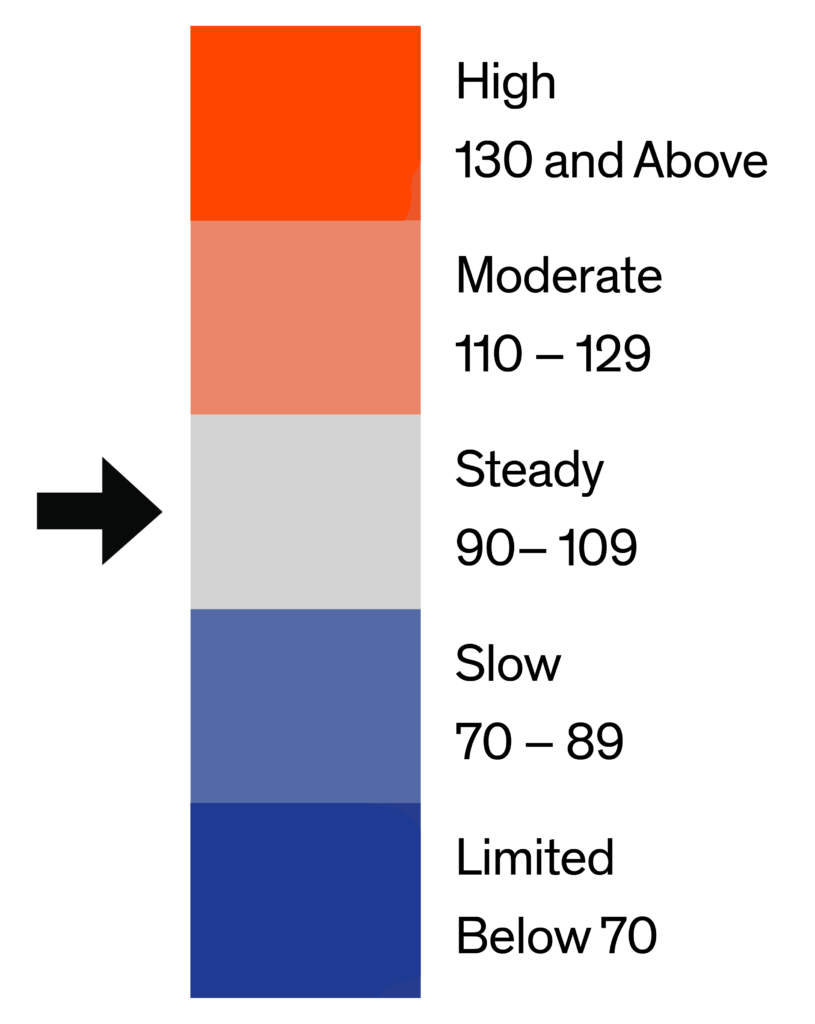
The Home Demand Index (HDI) for the Baltimore metro area stands at 87 for this report period, marking a decline from 92 last month and equal to the 87 recorded a year ago. This latest reading keeps the region in the Slow demand category, though the month-over-month drop points to seasonal softening or growing affordability constraints. With year-over-year demand unchanged, the market appears stable but lacks upward momentum as buyers weigh affordability pressures against limited inventory.
Demand by home type in Baltimore has declined across all segments. Entry-level single-family homes posted a demand index of 69, down from 71 last month and 73 a year ago, indicating persistent affordability challenges and soft buyer engagement. Mid-range single-family homes fell to 87 from 94 last month but remain at the same level as last year 87, showing stable interest among move-up buyers. Luxury single-family homes dropped to 102 from 116 last month but remain well above last year’s 91, signaling continued demand from affluent buyers despite recent softening. Entry-level condos declined to 110 from 120 but remain above last year’s 105, reflecting steady demand. Luxury condos decreased slightly to 155 from 163 but continue to outperform the broader market. Townhouses fell to 89 from 92 and remain below last year’s 92, indicating moderate cooling in this segment.

Monthly Statistics for September 2025
Home Demand
Index
Index
87
(Slow)
Home Demand Index
from prior month
from prior month
92
Home Demand Index
from prior year
from prior year
87
Index change
from prior month
from prior month
-5.4%
Index change from
same time last year
same time last year
0%
Bright MLS | T3 Home Demand Index
www.homedemandindex.com
Baltimore | September 2025
Home Demand Index | Historical Year-over-Year Comparison
Over the past 12 months, the Home Demand Index for Baltimore has returned to the same level as one year ago, with a current reading of 87 matching the index from September 2024. While last month’s index was higher at 92, the year-over-year flatline suggests a market that has leveled off following a period of modest gains earlier this year. This stability likely reflects a balance between persistent buyer interest and affordability challenges that continue to cap further demand growth.
Home Demand Index
Bright MLS | T3 Home Demand Index
www.homedemandindex.com
Baltimore | September 2025
Home Demand Map
Regional demand patterns across the Baltimore metro remain distinct this month. Howard County continues to lead the market with moderate buyer interest, reinforcing its position as the metro’s most competitive submarket. Harford, Anne Arundel, and Baltimore counties maintain steady demand, indicating resilience in the surrounding suburban markets. Meanwhile, Carroll County has shifted from steady to slow demand. Baltimore City continues to register limited demand, reflecting affordability barriers and ongoing caution among urban buyers.
Bright MLS | T3 Home Demand Index
www.homedemandindex.com
Baltimore | September 2025
Demand and Inventory by Home Type
Demand by home type in Baltimore has declined across all segments. Entry-level single-family homes posted a demand index of 69, down from 71 last month and 73 a year ago, indicating persistent affordability challenges and soft buyer engagement. Mid-range single-family homes fell to 87 from 94 last month but remain at the same level as last year 87, showing stable interest among move-up buyers. Luxury single-family homes dropped to 102 from 116 last month but remain well above last year’s 91, signaling continued demand from affluent buyers despite recent softening. Entry-level condos declined to 110 from 120 but remain above last year’s 105, reflecting steady demand. Luxury condos decreased slightly to 155 from 163 but continue to outperform the broader market. Townhouses fell to 89 from 92 and remain below last year’s 92, indicating moderate cooling in this segment.
Bright MLS | T3 Home Demand Index
www.homedemandindex.com
Baltimore | September 2025
Single Family Home Below $365k
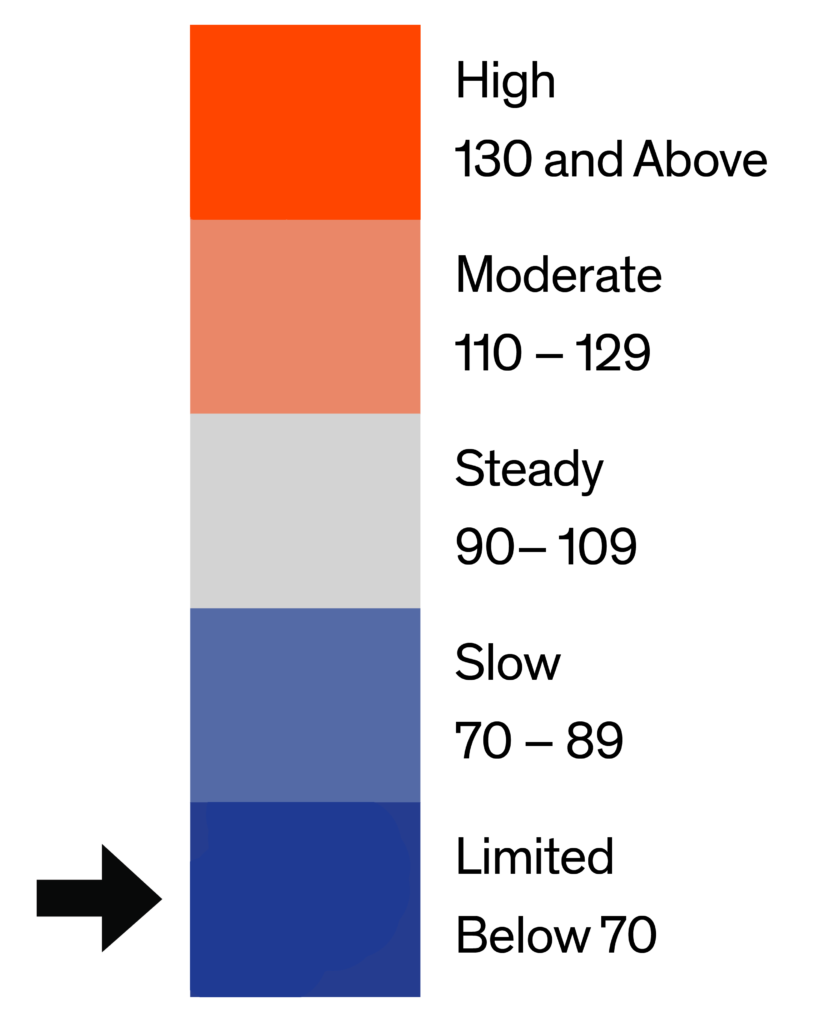
The index for entry-level single-family homes in Baltimore stands at 69 this month, down slightly from 71 last month and notably below the 73 recorded during the same period last year. This consistent downward trend signals a gradual weakening of buyer interest in the lower price tier, likely tied to persistent affordability concerns. Limited inventory and elevated mortgage rates may be constraining first-time buyer activity in this segment.

Monthly Statistics for Single Family Home Below $365k
Home Demand
Index
Index
69
(Limited)
Home Demand Index
from prior month
from prior month
71
Home Demand Index
from prior year
from prior year
73
Months of
inventory
inventory
2.4
Average daily inventory last month
633
Inventory sold
last month
last month
260
Bright MLS | T3 Home Demand Index
www.homedemandindex.com
Baltimore | September 2025
Single Family Home $365k - $830k
The index for mid-range single-family homes in Baltimore is 87 this month, reflecting a decline from 94 in the previous period but equal to the index reported one year ago. This movement suggests that while buyer interest has softened in the short term, overall demand remains consistent with last year. Stability in this segment indicates that move-up buyers are still active, though possibly more price-conscious amid economic uncertainty.

Monthly Statistics for Single Family Home $365k - $830k
Home Demand
Index
Index
87
(Slow)
Home Demand Index
from prior month
from prior month
94
Home Demand Index
from prior year
from prior year
87
Months of
Inventory
Inventory
1.9
Average daily inventory last month
1,631
Inventory sold
last month
last month
869
Bright MLS | T3 Home Demand Index
www.homedemandindex.com
Baltimore | September 2025
Single Family Home Above $830k
The index for luxury single-family homes in Baltimore stands at 102 this month, down from 116 last month but up from 91 during the same period last year. The month-over-month decline suggests a cooling in high-end demand, potentially influenced by seasonality or shifting investment strategies. Nevertheless, the strong year-over-year gain reflects continued strength in this segment, likely supported by cash buyers and limited high-quality inventory.

Monthly Statistics for Single Family Home Above $830k
Home Demand
Index
Index
102
(Steady)
Home Demand Index
from prior month
from prior month
116
Home Demand Index
from prior year
from prior year
91
Months of
Inventory
Inventory
2.9
Average daily inventory last month
685
Inventory sold
last month
last month
237
Bright MLS | T3 Home Demand Index
www.homedemandindex.com
Baltimore | September 2025
Condo Below $401k
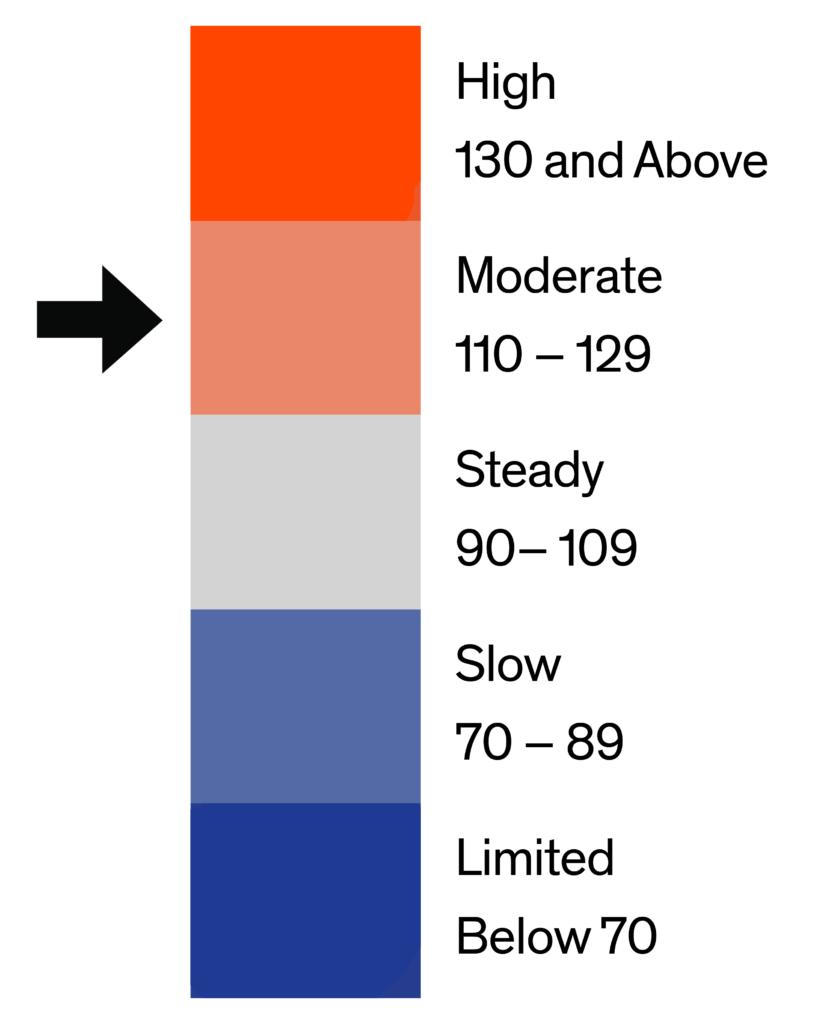
The index for entry-level condos in Baltimore is 110 this month, reflecting a decline from 120 last month but still up from 105 a year ago. This softening in month-over-month demand may signal seasonal moderation or buyer fatigue after recent surges. However, the year-over-year increase highlights sustained interest in this more affordable homeownership option, especially among budget-conscious buyers.

Monthly Statistics for Condo Below $401k
Home Demand
Index
Index
110
(Moderate)
Home Demand Index
from prior month
from prior month
120
Home Demand Index
from prior year
from prior year
105
Months of
Inventory
Inventory
2.9
Average daily inventory last month
485
Inventory sold
last month
last month
168
Bright MLS | T3 Home Demand Index
www.homedemandindex.com
Baltimore | September 2025
Condo Above $401k
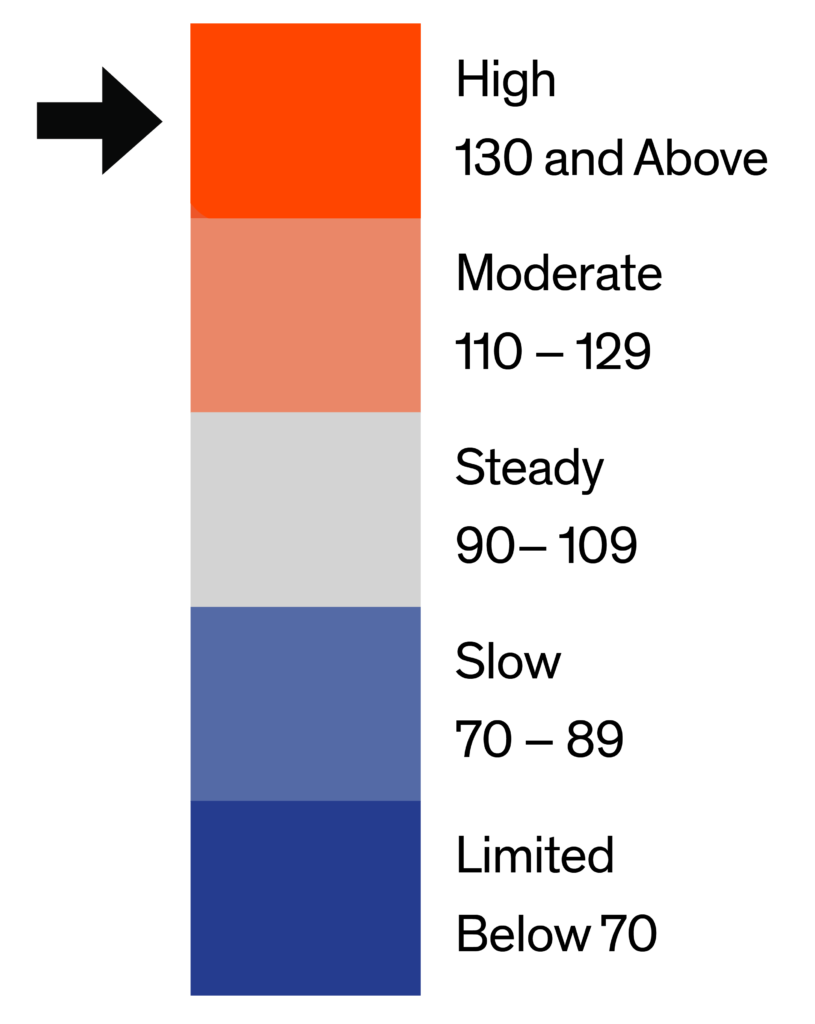
The index for luxury condos in Baltimore stands at 155 this month, a decline from 163 in the previous period but well above the 139 recorded during the same period last year. This month-over-month easing suggests a slight pullback in high-end buyer activity, potentially due to pricing sensitivity or seasonal trends. Still, the year-over-year growth underscores persistent demand in this segment, supported by affluent buyers seeking premium urban inventory.

Monthly Statistics for Condo Above $401k
Home Demand
Index
Index
155
(High)
Home Demand Index
from prior month
from prior month
163
Home Demand Index
from prior year
from prior year
139
Months of
Inventory
Inventory
5.5
Average daily inventory last month
164
Inventory sold
last month
last month
30
Bright MLS | T3 Home Demand Index
www.homedemandindex.com
Baltimore | September 2025
Townhouse/Rowhouse/Twin All prices
Townhouse/
Rowhouse/Twin
All prices
The index for townhouses, rowhouses, and twin homes in Baltimore is 89 this month, down slightly from 92 last month and also below the 92 recorded one year ago. This minor softening indicates a modest dip in buyer activity, possibly due to rising prices or competition from other home types. Demand in this segment has moved from steady to slow, reflecting reduced buyer activity in the urban market.

Monthly Statistics for Townhouse/Rowhouse/TwinAll prices
Home Demand
Index
Index
89
(Slow)
Home Demand Index
from prior month
from prior month
92
Home Demand Index
from prior year
from prior year
92
Months of
Inventory
Inventory
3.2
Average daily inventory last month
2,972
Inventory sold
last month
last month
943
Bright MLS | T3 Home Demand Index
www.homedemandindex.com
Note
1. This report is generated with data from the following counties:
- Baltimore Metro – Anne Arundel, MD; Baltimore City, MD; Baltimore, MD; Carroll, MD; Harford, MD; Howard, MD;
- DelMar Coastal – Somerset, MD; Sussex, DE; Wicomico, MD; Worcester, MD;
- Maryland Eastern Shore – Caroline, MD; Cecil, MD; Dorchester, MD; Kent, MD; Queen Annes, MD; Talbot, MD;
2. This report is for the September 2025 period with data collected from the previous month.
Released: September 11, 2025
Reference ID: 2300
Baltimore | September 2025
Home Demand Map (Zip Codes)
Regional demand patterns across the Baltimore metro remain distinct this month. Howard County continues to lead the market with moderate buyer interest, reinforcing its position as the metro’s most competitive submarket. Harford, Anne Arundel, and Baltimore counties maintain steady demand, indicating resilience in the surrounding suburban markets. Meanwhile, Carroll County has shifted from steady to slow demand. Baltimore City continues to register limited demand, reflecting affordability barriers and ongoing caution among urban buyers.

Bright MLS | T3 Home Demand Index
www.homedemandindex.com