October 2025 Report
Baltimore Metro
Baltimore | October 2025
Home Demand Index
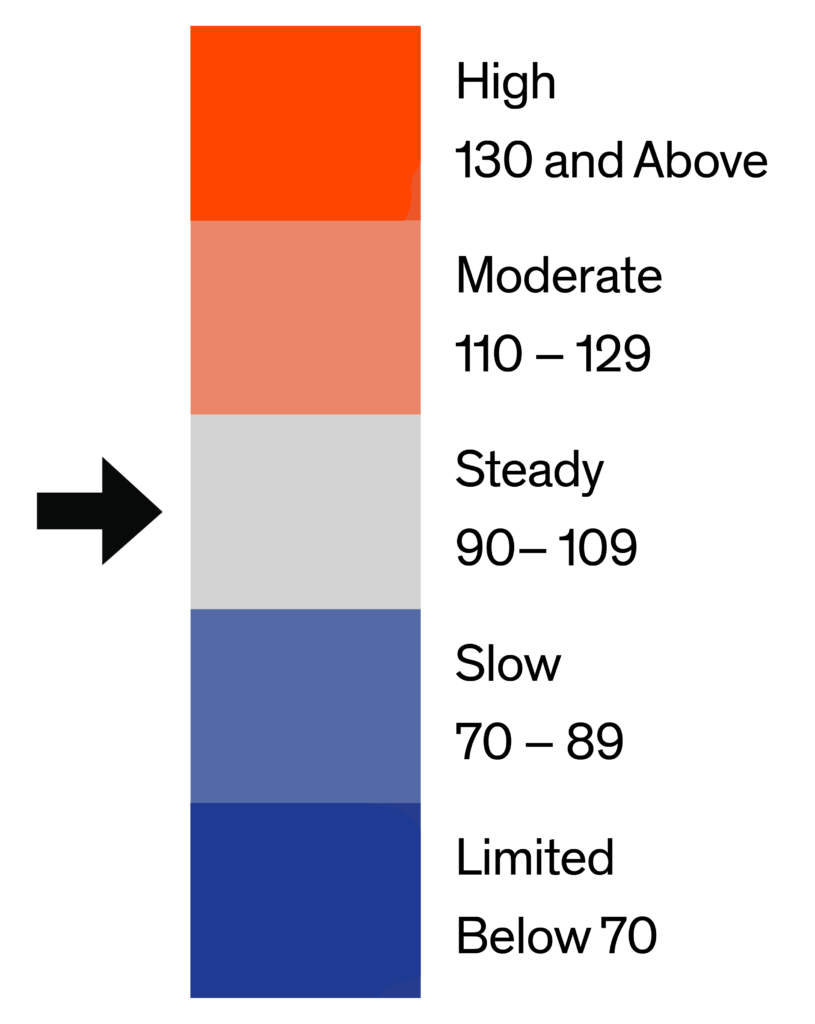
The Home Demand Index (HDI) for the Baltimore metro area stands at 87 for this report period, marking a decrease from 89 last month and matching the 87 recorded during the same period last year. This consistency on a year-over-year basis indicates a stable but subdued level of buyer activity, keeping the market within the Slow demand range. The month-over-month decline points to typical seasonal cooling and continued affordability challenges, as higher borrowing costs and limited supply temper buyer engagement.
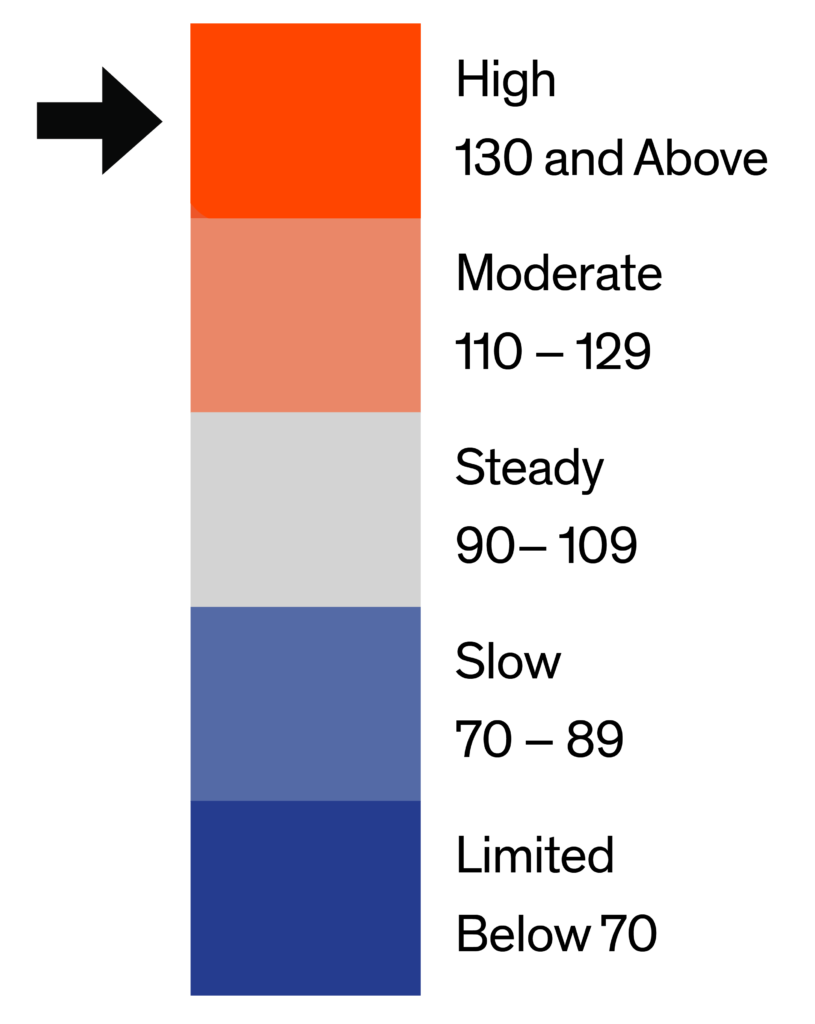
Demand by home type in Baltimore has softened slightly this period. Entry-level single-family homes recorded a Home Demand Index (HDI) of 73, down from 74 last month and below last year’s 79, signaling continued affordability challenges for first-time buyers. Mid-range single-family homes declined to 86 from 89 last month but remain close to last year’s 87, indicating steady interest among move-up buyers. Luxury single-family homes held at 103, remaining well above last year’s 90, reflecting ongoing engagement from affluent purchasers despite some cooling momentum. Entry-level condos posted an HDI of 105, down from 114 but still above 103 a year ago, while luxury condos eased slightly to 162 from 157 yet remain notably strong. Townhouses declined to 89 from 91, just below last year’s level, suggesting moderate cooling in attached-home demand.

Monthly Statistics for October 2025
Home Demand
Index
Index
87
(Slow)
Home Demand Index
from prior month
from prior month
89
Home Demand Index
from prior year
from prior year
87
Index change
from prior month
from prior month
-2.2%
Index change from
same time last year
same time last year
0%
Bright MLS | T3 Home Demand Index
www.homedemandindex.com
Baltimore | October 2025
Home Demand Index | Historical Year-over-Year Comparison
Over the past 12 months, the Home Demand Index for Baltimore has held steady, with the current reading of 87 identical to the level recorded one year ago. Although the index eased from last month’s 89, the flat year-over-year comparison signals a balanced market where modest gains earlier in the year have leveled off. This trend suggests that while buyer interest persists, affordability constraints and limited inventory continue to moderate overall demand.
Home Demand Index
Bright MLS | T3 Home Demand Index
www.homedemandindex.com
Baltimore | October 2025
Home Demand Map
Regional demand patterns across the Baltimore metro remain mixed this month. Howard County continues to lead with moderate buyer activity, underscoring its ongoing strength as the metro’s most competitive submarket. Harford, and Baltimore counties maintain steady demand, suggesting resilience in suburban markets. Meanwhile, Anne Arundel, and Carroll counties have eased to slow demand, and Baltimore City remains at limited demand levels, reflecting affordability barriers and cautious urban buyer sentiment.
Bright MLS | T3 Home Demand Index
www.homedemandindex.com
Baltimore | October 2025
Demand and Inventory by Home Type
Demand by home type in Baltimore has softened slightly this period. Entry-level single-family homes recorded a Home Demand Index (HDI) of 73, down from 74 last month and below last year’s 79, signaling continued affordability challenges for first-time buyers. Mid-range single-family homes declined to 86 from 89 last month but remain close to last year’s 87, indicating steady interest among move-up buyers. Luxury single-family homes held at 103, remaining well above last year’s 90, reflecting ongoing engagement from affluent purchasers despite some cooling momentum. Entry-level condos posted an HDI of 105, down from 114 but still above 103 a year ago, while luxury condos eased slightly to 162 from 157 yet remain notably strong. Townhouses declined to 89 from 91, just below last year’s level, suggesting moderate cooling in attached-home demand.
Bright MLS | T3 Home Demand Index
www.homedemandindex.com
Baltimore | October 2025
Single Family Home Below $365k
The index for entry-level single-family homes in Baltimore stands at 73 this month, down marginally from 74 last month and below the 79 recorded one year ago. This decline reflects continued affordability challenges weighing on first-time buyers, with demand remaining in the slow range. Despite the softening, this segment continues to attract consistent interest from cost-conscious buyers seeking entry points into homeownership.

Monthly Statistics for Single Family Home Below $365k
Home Demand
Index
Index
73
(Slow)
Home Demand Index
from prior month
from prior month
74
Home Demand Index
from prior year
from prior year
79
Months of
inventory
inventory
2.6
Average daily inventory last month
726
Inventory sold
last month
last month
282
Bright MLS | T3 Home Demand Index
www.homedemandindex.com
Baltimore | October 2025
Single Family Home $365k - $830k
The index for mid-range single-family homes in Baltimore declined to 86 this month, down from 89 in the prior report and slightly below last year’s 87. This softening suggests a moderate cooling in buyer activity, likely tied to affordability constraints and seasonal factors. Nonetheless, demand in this segment remains steady overall, supported by continued interest from established buyers seeking move-up opportunities within the metro area.

Monthly Statistics for Single Family Home $365k - $830k
Home Demand
Index
Index
86
(Slow)
Home Demand Index
from prior month
from prior month
89
Home Demand Index
from prior year
from prior year
87
Months of
Inventory
Inventory
2.3
Average daily inventory last month
1,667
Inventory sold
last month
last month
739
Bright MLS | T3 Home Demand Index
www.homedemandindex.com
Baltimore | October 2025
Single Family Home Above $830k
The Home Demand Index for luxury single-family homes in Baltimore is 103 this month, unchanged from last month but up from 90 a year ago. The flat month-over-month reading suggests a short-term seasonal cooling in high-end demand or a temporary shift in investment sentiment. Nonetheless, the notable year-over-year increase indicates sustained buyer strength in the luxury segment, supported by affluent purchasers who are less sensitive to mortgage rate pressures.

Monthly Statistics for Single Family Home Above $830k
Home Demand
Index
Index
103
(Steady)
Home Demand Index
from prior month
from prior month
103
Home Demand Index
from prior year
from prior year
90
Months of
Inventory
Inventory
3.6
Average daily inventory last month
658
Inventory sold
last month
last month
184
Bright MLS | T3 Home Demand Index
www.homedemandindex.com
Baltimore | October 2025
Condo Below $400k
The index for entry-level condos in Baltimore stands at 105 this month, down from 114 last month but slightly higher than last year’s 103. This month-over-month dip indicates a mild easing in demand following several strong reporting periods, though year-over-year gains highlight the segment’s enduring appeal among affordability-driven buyers. Entry-level condos continue to perform well relative to the broader market, supported by limited supply and consistent buyer interest.

Monthly Statistics for Condo Below $400k
Home Demand
Index
Index
105
(Steady)
Home Demand Index
from prior month
from prior month
114
Home Demand Index
from prior year
from prior year
103
Months of
Inventory
Inventory
3
Average daily inventory last month
482
Inventory sold
last month
last month
161
Bright MLS | T3 Home Demand Index
www.homedemandindex.com
Baltimore | October 2025
Condo Above $400k
The index for luxury condos in Baltimore rose to 162 this month, up from 157 last month and notably higher than the 145 recorded a year ago. This continued upward trend reflects strengthening buyer interest in the high-end condo market, driven by lifestyle preferences and limited availability of premium inventory. The segment remains one of the metro area’s strongest performers, underscoring sustained confidence among affluent buyers despite broader market moderation.

Monthly Statistics for Condo Above $400k
Home Demand
Index
Index
162
(High)
Home Demand Index
from prior month
from prior month
157
Home Demand Index
from prior year
from prior year
145
Months of
Inventory
Inventory
5.4
Average daily inventory last month
162
Inventory sold
last month
last month
30
Bright MLS | T3 Home Demand Index
www.homedemandindex.com
Baltimore | October 2025
Townhouse/Rowhouse/Twin All prices
Townhouse/
Rowhouse/Twin
All prices
The index for townhouses, rowhouses, and twin homes in Baltimore stands at 89 this month, a slight decline from 91 last month and just below the 91 recorded one year ago. This modest softening points to stable but slightly reduced demand, likely reflecting normal seasonal cooling. Nevertheless, attached homes remain appealing to buyers seeking a balance of affordability and space, helping sustain steady engagement across this segment.

Monthly Statistics for Townhouse/Rowhouse/TwinAll prices
Home Demand
Index
Index
89
(Slow)
Home Demand Index
from prior month
from prior month
91
Home Demand Index
from prior year
from prior year
91
Months of
Inventory
Inventory
3.6
Average daily inventory last month
3,188
Inventory sold
last month
last month
890
Bright MLS | T3 Home Demand Index
www.homedemandindex.com
Note
1. This report is generated with data from the following counties:
- Baltimore Metro – Anne Arundel, MD; Baltimore City, MD; Baltimore, MD; Carroll, MD; Harford, MD; Howard, MD;
- DelMar Coastal – Somerset, MD; Sussex, DE; Wicomico, MD; Worcester, MD;
- Maryland Eastern Shore – Caroline, MD; Cecil, MD; Dorchester, MD; Kent, MD; Queen Annes, MD; Talbot, MD;
2. This report is for the October 2025 period with data collected from the previous month.
Released: October 12, 2025
Reference ID: 2315
Baltimore | October 2025
Home Demand Map (Zip Codes)
Regional demand patterns across the Baltimore metro remain mixed this month. Howard County continues to lead with moderate buyer activity, underscoring its ongoing strength as the metro’s most competitive submarket. Harford, and Baltimore counties maintain steady demand, suggesting resilience in suburban markets. Meanwhile, Anne Arundel, and Carroll counties have eased to slow demand, and Baltimore City remains at limited demand levels, reflecting affordability barriers and cautious urban buyer sentiment.

Bright MLS | T3 Home Demand Index
www.homedemandindex.com