July 2025 Report
Baltimore Metro
Baltimore | July 2025
Home Demand Index
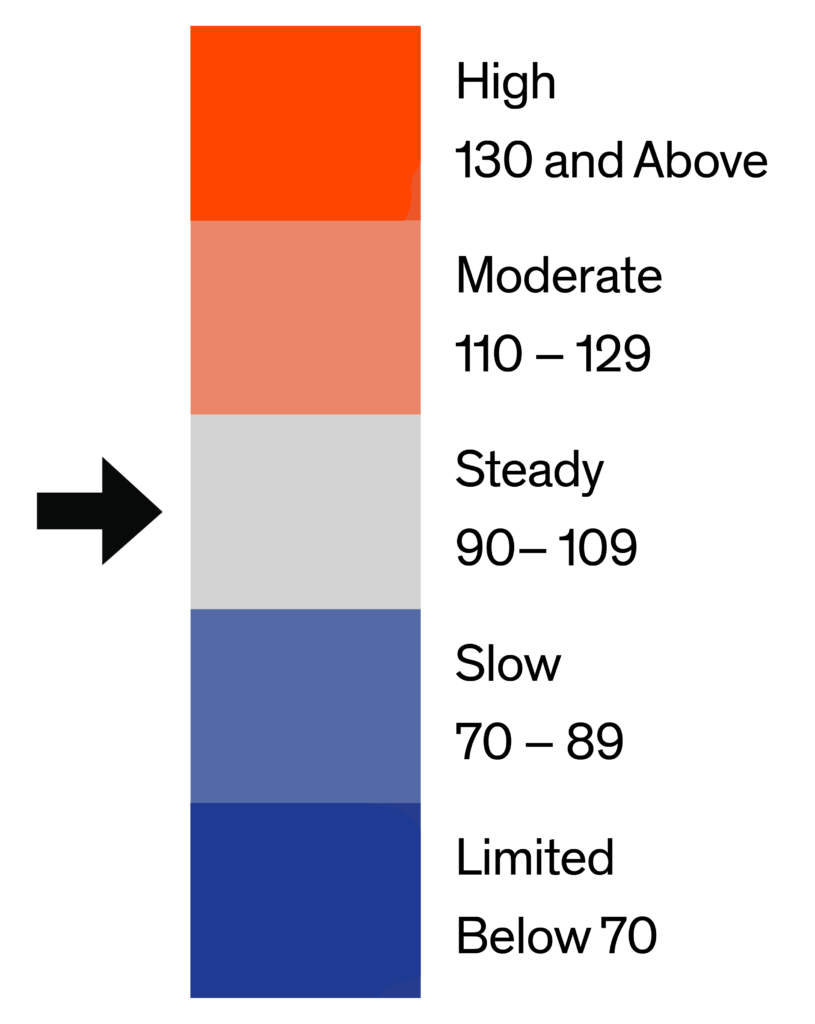
The Home Demand Index (HDI) for the Baltimore metro area currently stands at 92, reflecting a notable decline from 98 last month but still higher than the 81 recorded a year ago. This places the market firmly in the Steady demand category, despite the recent softening in activity. The month-over-month dip suggests a slowdown likely tied to seasonal transitions or buyer hesitation, but the year-over-year gain highlights an overall improvement in market confidence compared to last summer.
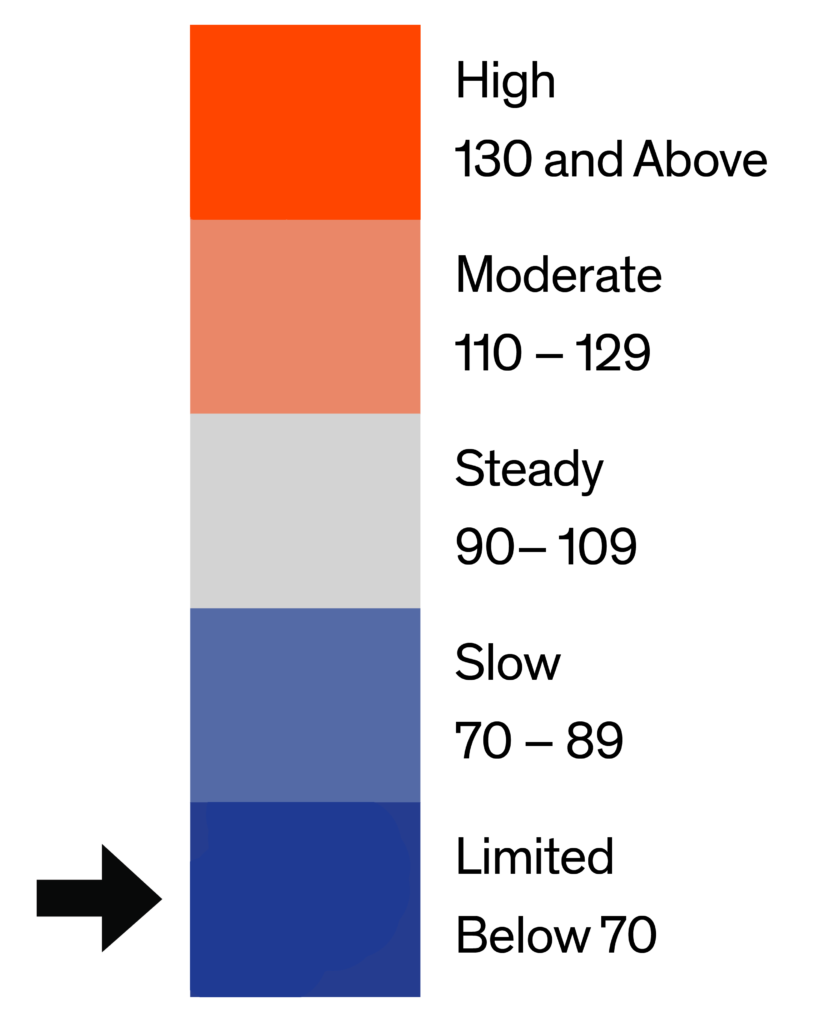
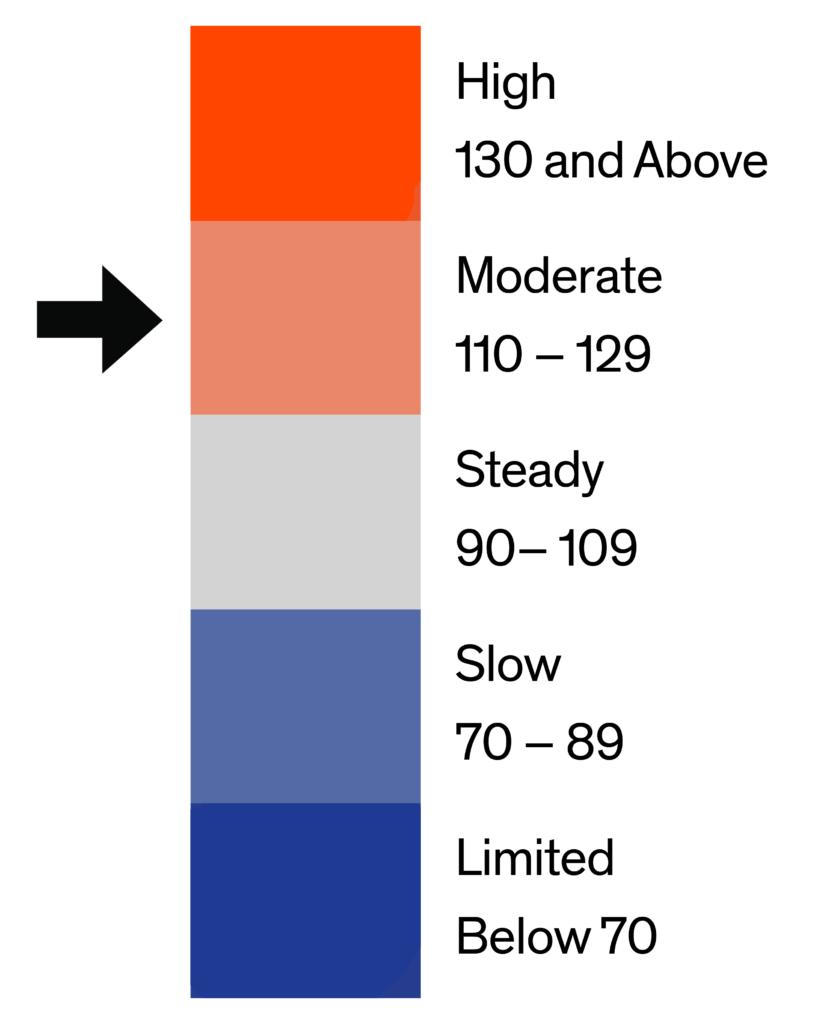
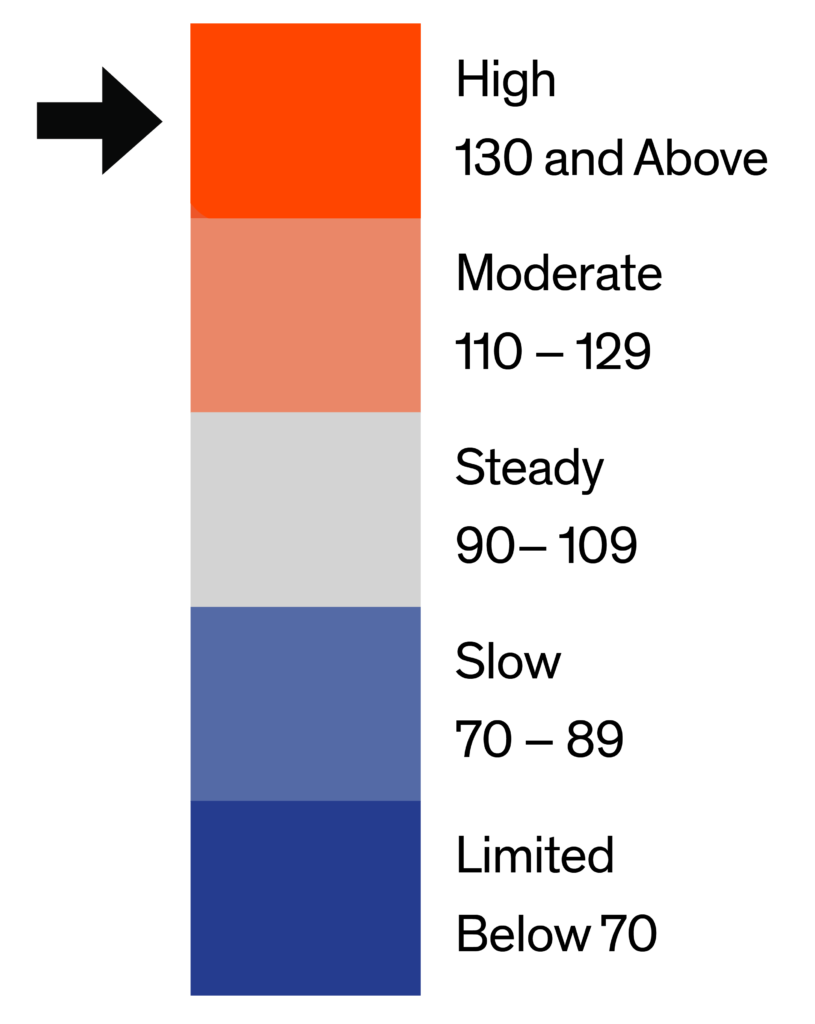
Demand across property types in Baltimore shows a mixed picture this month. Entry-level single-family homes posted an index of 67, down from 72 last month but slightly above last year’s 65, indicating ongoing affordability challenges in the lower price bracket. Mid-range single-family homes dipped to 94 from 101, though demand remains notably stronger than last year’s 82, pointing to continued interest from move-up buyers. Luxury single-family homes decreased to 129 from 136, but demand remains well above last year’s 91, reflecting sustained strength in the upper-tier market. Entry-level condos fell to 121 from 136 but are still outperforming last year’s level of 90, signaling steady demand from first-time and budget-conscious buyers. Luxury condos edged up slightly to 158 from 153, with demand continuing to exceed last year’s 135, suggesting ongoing interest in high-end urban living. Townhouses declined to 90 from 96, yet remain above last year’s 80, indicating modest cooling but overall stable buyer interest.

Monthly Statistics for July 2025
Home Demand
Index
Index
92
(Steady)
Home Demand Index
from prior month
from prior month
98
Home Demand Index
from prior year
from prior year
81
Index change
from prior month
from prior month
-6.1%
Index change from
same time last year
same time last year
13.6%
Bright MLS | T3 Home Demand Index
www.homedemandindex.com
Baltimore | July 2025
Home Demand Index | Historical Year-over-Year Comparison
Over the past 12 months, the Home Demand Index (HDI) for Baltimore has risen from 81 last year to 92 this month, indicating a 14% year-over-year gain. While the index declined from 98 last month, the longer-term trend remains positive, with demand generally trending upward across the year. This performance suggests a recovering market with stronger buyer engagement than last summer, despite short-term fluctuations likely tied to seasonality or affordability pressures.
Home Demand Index
Bright MLS | T3 Home Demand Index
www.homedemandindex.com
Baltimore | July 2025
Home Demand Map
Buyer activity across the Baltimore metro area shows continued regional variation. Howard County remains the strongest market with high buyer demand. Harford, Carroll, Anne Arundel, and Baltimore counties are maintaining steady demand, indicating ongoing interest across much of the suburban market. Meanwhile, Baltimore City continues to show slow demand, reflecting persistent challenges in urban affordability and buyer sentiment.
Bright MLS | T3 Home Demand Index
www.homedemandindex.com
Baltimore | July 2025
Demand and Inventory by Home Type
Demand across property types in Baltimore shows a mixed picture this month. Entry-level single-family homes posted an index of 67, down from 72 last month but slightly above last year’s 65, indicating ongoing affordability challenges in the lower price bracket. Mid-range single-family homes dipped to 94 from 101, though demand remains notably stronger than last year’s 82, pointing to continued interest from move-up buyers. Luxury single-family homes decreased to 129 from 136, but demand remains well above last year’s 91, reflecting sustained strength in the upper-tier market. Entry-level condos fell to 121 from 136 but are still outperforming last year’s level of 90, signaling steady demand from first-time and budget-conscious buyers. Luxury condos edged up slightly to 158 from 153, with demand continuing to exceed last year’s 135, suggesting ongoing interest in high-end urban living. Townhouses declined to 90 from 96, yet remain above last year’s 80, indicating modest cooling but overall stable buyer interest.
Bright MLS | T3 Home Demand Index
www.homedemandindex.com
Baltimore | July 2025
Single Family Home Below $361k
The index for entry-level single-family homes in Baltimore dropped to 67 this month, down from 72 last month but still slightly above the 65 recorded one year ago. This suggests a modest softening in demand, potentially reflecting seasonal transitions or persistent affordability pressures. Despite the decline, the segment remains relatively stable on a year-over-year basis, supported by structural demand among first-time buyers.

Monthly Statistics for Single Family Home Below $361k
Home Demand
Index
Index
67
(Limited)
Home Demand Index
from prior month
from prior month
72
Home Demand Index
from prior year
from prior year
65
Months of
inventory
inventory
2.3
Average daily inventory last month
576
Inventory sold
last month
last month
249
Bright MLS | T3 Home Demand Index
www.homedemandindex.com
Baltimore | July 2025
Single Family Home $361k - $825k
The Home Demand Index for mid-range single-family homes in Baltimore stands at 94 during this report period, down from 101 last month but notably higher than the 82 recorded one year ago. The decrease in buyer activity compared to last month suggests a possible seasonal slowdown or affordability pressures, yet the year-over-year growth underscores ongoing interest in this segment despite limited inventory.

Monthly Statistics for Single Family Home $361k - $825k
Home Demand
Index
Index
94
(Steady)
Home Demand Index
from prior month
from prior month
101
Home Demand Index
from prior year
from prior year
82
Months of
Inventory
Inventory
1.8
Average daily inventory last month
1,556
Inventory sold
last month
last month
866
Bright MLS | T3 Home Demand Index
www.homedemandindex.com
Baltimore | July 2025
Single Family Home Above $825k
The index for luxury single-family homes in Baltimore declined to 129 during this report period, down from 136 last month but well above the 91 recorded one year ago. This substantial year-over-year increase underscores strong, sustained interest in the high-end market, likely fueled by affluent buyers with greater financial flexibility. Despite the month-over-month dip, this segment remains among the most active, reflecting a robust appetite for premium properties.

Monthly Statistics for Single Family Home Above $825k
Home Demand
Index
Index
129
(Moderate)
Home Demand Index
from prior month
from prior month
136
Home Demand Index
from prior year
from prior year
91
Months of
Inventory
Inventory
2.4
Average daily inventory last month
718
Inventory sold
last month
last month
305
Bright MLS | T3 Home Demand Index
www.homedemandindex.com
Baltimore | July 2025
Condo Below $406k
The Home Demand Index for entry-level condos in Baltimore declined to 121 this month, down from 136 last month, but remains well above last year’s 90. Despite the month-over-month cooling, demand in this segment stays elevated, reflecting continued interest from first-time buyers and those priced out of detached homes. The affordability and lower maintenance of condos make them an appealing alternative in a competitive housing environment.

Monthly Statistics for Condo Below $406k
Home Demand
Index
Index
121
(Moderate)
Home Demand Index
from prior month
from prior month
136
Home Demand Index
from prior year
from prior year
90
Months of
Inventory
Inventory
2.6
Average daily inventory last month
503
Inventory sold
last month
last month
190
Bright MLS | T3 Home Demand Index
www.homedemandindex.com
Baltimore | July 2025
Condo Above $406k
Luxury condos in the Baltimore market rose to an index of 158 this month, up from 153 in the previous month and notably higher than the 135 recorded last year. This steady upward trend reflects very strong demand, bolstered by affluent buyers seeking lifestyle-driven properties in prime locations. The segment continues to outperform, illustrating the resilience of luxury urban living even as other parts of the market moderate.

Monthly Statistics for Condo Above $406k
Home Demand
Index
Index
158
(High)
Home Demand Index
from prior month
from prior month
153
Home Demand Index
from prior year
from prior year
135
Months of
Inventory
Inventory
5.1
Average daily inventory last month
152
Inventory sold
last month
last month
30
Bright MLS | T3 Home Demand Index
www.homedemandindex.com
Baltimore | July 2025
Townhouse/Rowhouse/Twin All prices
Townhouse/
Rowhouse/Twin
All prices
The index for townhouses, rowhouses, and twin homes in Baltimore declined to 90 this month, down from 96 last month but still above the 83 recorded one year ago. While demand has softened slightly, the segment remains in the Steady category, supported by its relative affordability and appeal in both urban and suburban settings. Continued buyer interest in attached homes suggests this segment remains a viable option for those seeking value and location advantages.

Monthly Statistics for Townhouse/Rowhouse/TwinAll prices
Home Demand
Index
Index
90
(Steady)
Home Demand Index
from prior month
from prior month
96
Home Demand Index
from prior year
from prior year
83
Months of
Inventory
Inventory
2.5
Average daily inventory last month
2,690
Inventory sold
last month
last month
1,094
Bright MLS | T3 Home Demand Index
www.homedemandindex.com
Note
1. This report is generated with data from the following counties:
- Baltimore Metro – Anne Arundel, MD; Baltimore City, MD; Baltimore, MD; Carroll, MD; Harford, MD; Howard, MD;
- DelMar Coastal – Somerset, MD; Sussex, DE; Wicomico, MD; Worcester, MD;
- Maryland Eastern Shore – Caroline, MD; Cecil, MD; Dorchester, MD; Kent, MD; Queen Annes, MD; Talbot, MD;
2. This report is for the July 2025 period with data collected from the previous month.
Released: July 10, 2025
Reference ID: 2270
Baltimore | July 2025
Home Demand Map (Zip Codes)
Buyer activity across the Baltimore metro area shows continued regional variation. Howard County remains the strongest market with high buyer demand. Harford, Carroll, Anne Arundel, and Baltimore counties are maintaining steady demand, indicating ongoing interest across much of the suburban market. Meanwhile, Baltimore City continues to show slow demand, reflecting persistent challenges in urban affordability and buyer sentiment.

Bright MLS | T3 Home Demand Index
www.homedemandindex.com