August 2025 Report
Baltimore Metro
Baltimore | August 2025
Home Demand Index
The Home Demand Index (HDI) for the Baltimore metro area currently stands at 89, reflecting a notable decrease from 95 last month and slightly below the 90 recorded during the same period last year. This month’s reading places the region in the Steady demand category, but the month-over-month dip suggests a seasonal cooling or increased buyer hesitancy amid affordability pressures. The minimal year-over-year change indicates that while demand has softened in the short term, market sentiment remains relatively stable compared to last summer.
Demand by home type in Baltimore reveals diverging trends this month. Entry-level single-family homes registered an index of 67, down from 71 last month, suggesting growing affordability challenges despite a slight improvement over last year. Mid-range single-family homes dipped to 91 from 97 but remain stronger than the 89 recorded a year ago, indicating sustained interest from move-up buyers. The luxury single-family segment declined to 114 from 130 but far exceeds last year’s 101, highlighting ongoing strength in the high-end market. Entry-level condos dropped to 114 from 124, though demand remains elevated versus last year’s 107, while luxury condos rose to 161 from 158, continuing to lead the market with persistent high demand. Townhouses decreased to 90 from 93 last month and 94 a year ago, indicating a modest decline in buyer interest for this versatile segment.

Monthly Statistics for August 2025
Home Demand
Index
Index
89
(Slow)
Home Demand Index
from prior month
from prior month
95
Home Demand Index
from prior year
from prior year
90
Index change
from prior month
from prior month
-6.3%
Index change from
same time last year
same time last year
-1.1%
Bright MLS | T3 Home Demand Index
www.homedemandindex.com
Baltimore | August 2025
Home Demand Index | Historical Year-over-Year Comparison
Over the past 12 months, the Home Demand Index (HDI) for Baltimore has fluctuated but ultimately declined slightly from 90 last year to 89 in the current period. While last month’s reading of 95 marked a higher point, the general trend suggests a leveling off in demand after a period of modest recovery. The relatively flat year-over-year comparison underscores a market in equilibrium, where rising costs may be balancing out underlying buyer interest.
Home Demand Index
Bright MLS | T3 Home Demand Index
www.homedemandindex.com
Baltimore | August 2025
Home Demand Map
Buyer activity across the Baltimore metro continues to show distinct regional differences. Howard County remains the most robust submarket, sustaining high demand levels, while Harford, Carroll, Anne Arundel, and Baltimore counties maintain steady buyer interest, suggesting healthy suburban engagement. Baltimore City, however, continues to lag with slow demand, reflecting ongoing affordability barriers and muted urban buyer confidence.
Bright MLS | T3 Home Demand Index
www.homedemandindex.com
Baltimore | August 2025
Demand and Inventory by Home Type
Demand by home type in Baltimore reveals diverging trends this month. Entry-level single-family homes registered an index of 67, down from 71 last month, suggesting growing affordability challenges despite a slight improvement over last year. Mid-range single-family homes dipped to 91 from 97 but remain stronger than the 89 recorded a year ago, indicating sustained interest from move-up buyers. The luxury single-family segment declined to 114 from 130 but far exceeds last year’s 101, highlighting ongoing strength in the high-end market. Entry-level condos dropped to 114 from 124, though demand remains elevated versus last year’s 107, while luxury condos rose to 161 from 158, continuing to lead the market with persistent high demand. Townhouses decreased to 90 from 93 last month and 94 a year ago, indicating a modest decline in buyer interest for this versatile segment.
Bright MLS | T3 Home Demand Index
www.homedemandindex.com
Baltimore | August 2025
Single Family Home Below $365k
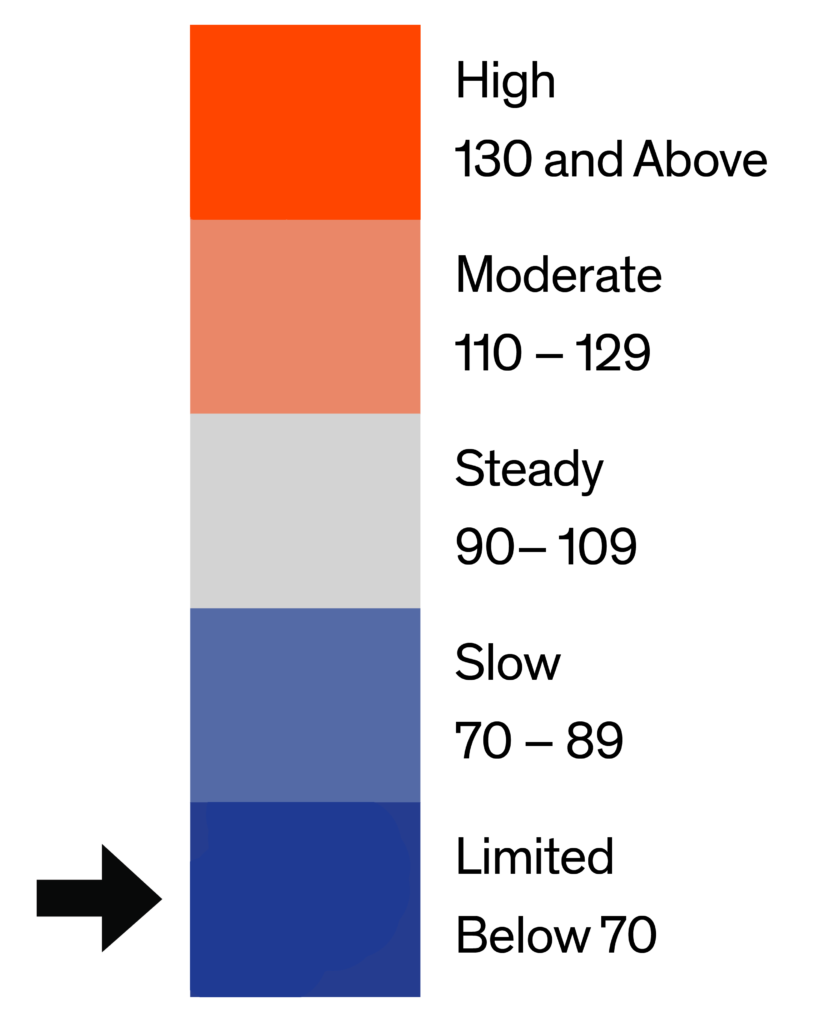
The index for entry-level single-family homes in Baltimore stands at 67, down from 71 last month and 76 a year ago. This consistent decline suggests buyer demand is cooling, likely influenced by ongoing affordability pressures and seasonal factors. Limited inventory remains a challenge, but this segment continues to draw interest from first-time buyers.

Monthly Statistics for Single Family Home Below $365k
Home Demand
Index
Index
67
(Limited)
Home Demand Index
from prior month
from prior month
71
Home Demand Index
from prior year
from prior year
76
Months of
inventory
inventory
2.3
Average daily inventory last month
603
Inventory sold
last month
last month
267
Bright MLS | T3 Home Demand Index
www.homedemandindex.com
Baltimore | August 2025
Single Family Home $365k - $825k
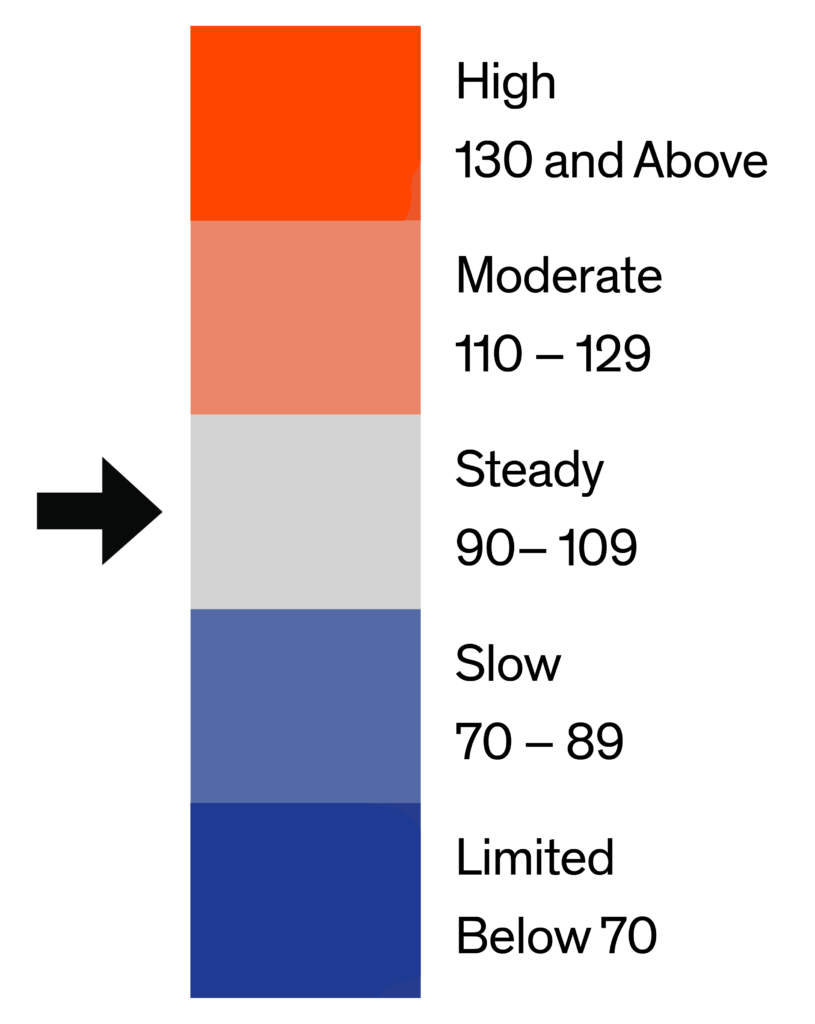
The Home Demand Index for mid-range single-family homes in Baltimore is 91 this month, down from 97 last month but slightly higher than the 89 recorded last year. The decline from June indicates a possible seasonal deceleration or softening demand tied to affordability constraints. However, the year-over-year increase suggests this segment remains attractive to move-up buyers seeking balance between space and price.

Monthly Statistics for Single Family Home $365k - $825k
Home Demand
Index
Index
91
(Steady)
Home Demand Index
from prior month
from prior month
97
Home Demand Index
from prior year
from prior year
89
Months of
Inventory
Inventory
1.9
Average daily inventory last month
1,629
Inventory sold
last month
last month
843
Bright MLS | T3 Home Demand Index
www.homedemandindex.com
Baltimore | August 2025
Single Family Home Above $825k
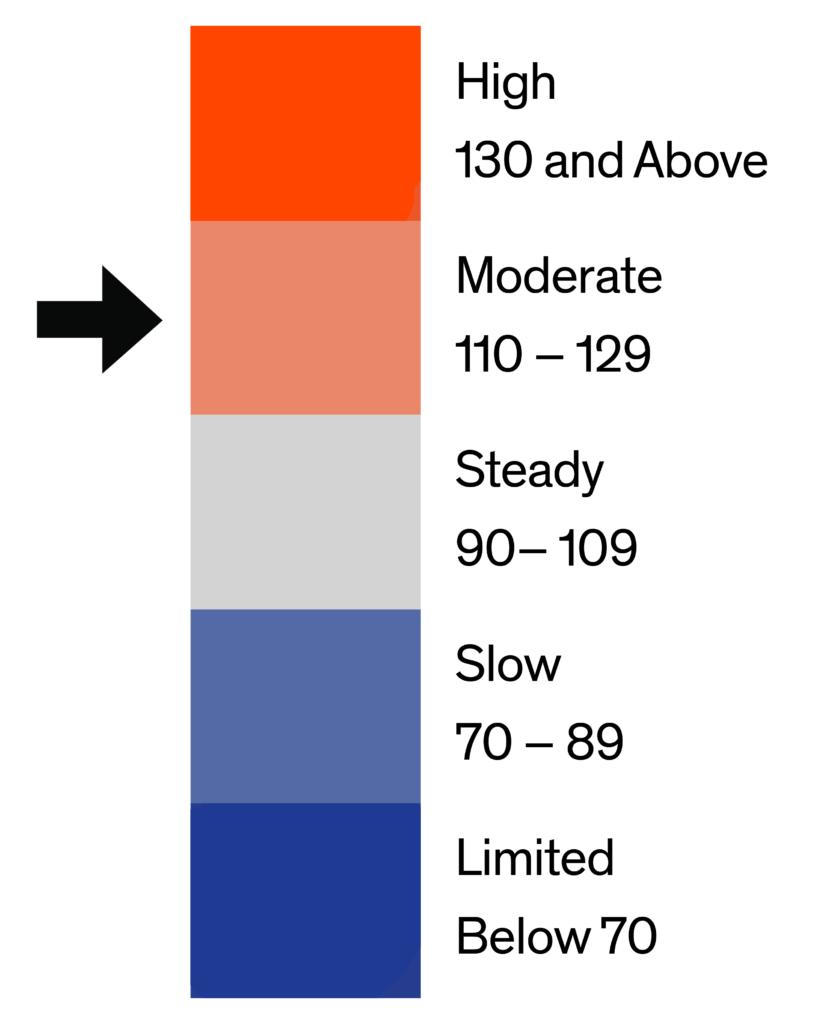
The index for luxury single-family homes in Baltimore dropped to 114 this month, down from 130 last month but well above the 101 posted one year ago. This significant year-over-year increase reflects continued buyer strength in the high-end market, likely fueled by affluent purchasers less impacted by financing constraints. Despite the short-term dip, this segment remains one of the strongest-performing tiers in the market.

Monthly Statistics for Single Family Home Above $825k
Home Demand
Index
Index
114
(Moderate)
Home Demand Index
from prior month
from prior month
130
Home Demand Index
from prior year
from prior year
101
Months of
Inventory
Inventory
2.8
Average daily inventory last month
728
Inventory sold
last month
last month
263
Bright MLS | T3 Home Demand Index
www.homedemandindex.com
Baltimore | August 2025
Condo Below $400k
The index for entry-level condos in Baltimore declined to 114 this month, down from 124 last month but well above the 107 recorded a year ago. The decrease in demand may reflect seasonal trends or rising price sensitivity, yet overall interest remains elevated. This segment continues to appeal to first-time buyers and downsizers seeking affordable, low-maintenance housing alternatives.

Monthly Statistics for Condo Below $400k
Home Demand
Index
Index
114
(Moderate)
Home Demand Index
from prior month
from prior month
124
Home Demand Index
from prior year
from prior year
107
Months of
Inventory
Inventory
2.5
Average daily inventory last month
492
Inventory sold
last month
last month
195
Bright MLS | T3 Home Demand Index
www.homedemandindex.com
Baltimore | August 2025
Condo Above $400k
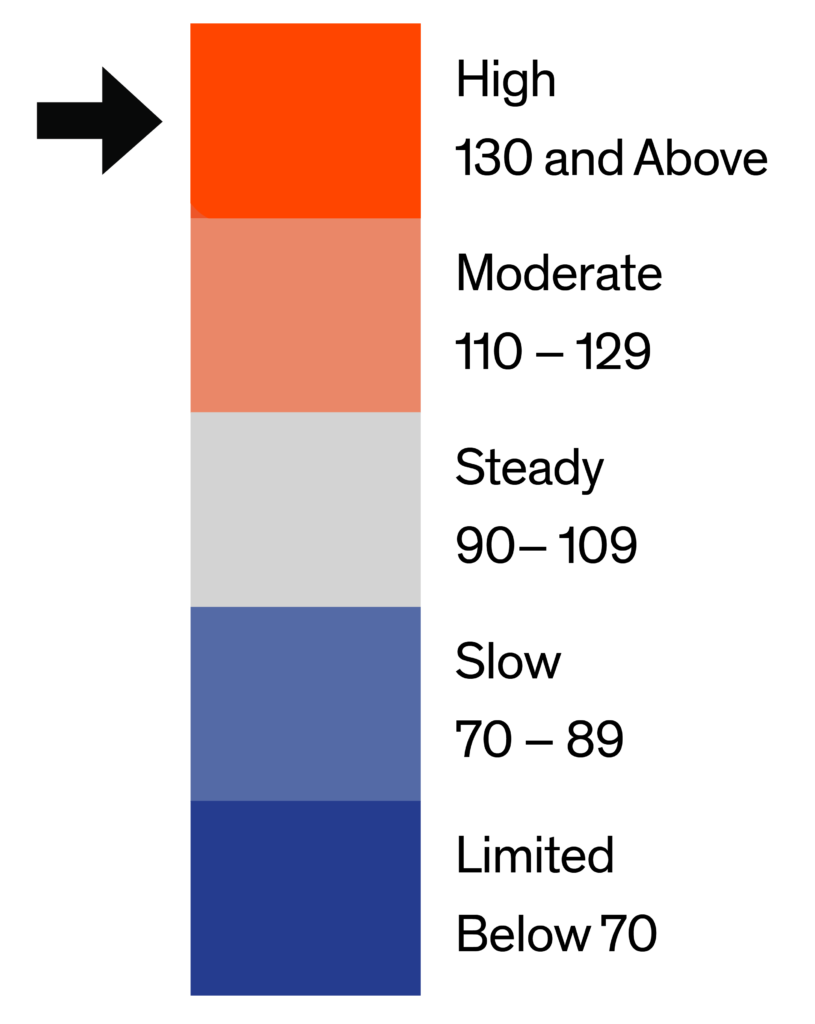
Luxury condos in Baltimore registered an index of 161 this month, up from 158 in both the prior month and a year ago. This consistent growth signals sustained interest from affluent buyers seeking high-end, urban-oriented living. The segment continues to outperform others, underscoring the resilience and appeal of lifestyle-driven properties.

Monthly Statistics for Condo Above $400k
Home Demand
Index
Index
161
(High)
Home Demand Index
from prior month
from prior month
158
Home Demand Index
from prior year
from prior year
158
Months of
Inventory
Inventory
6
Average daily inventory last month
155
Inventory sold
last month
last month
26
Bright MLS | T3 Home Demand Index
www.homedemandindex.com
Baltimore | August 2025
Townhouse/Rowhouse/Twin All prices
Townhouse/
Rowhouse/Twin
All prices
The index for townhouses, rowhouses, and twins in Baltimore dropped to 90 this month from 93 last month but remains above last year’s level of 94. While demand has softened slightly, the segment still sits in the Steady category, supported by its affordability and versatility across urban and suburban neighborhoods. Buyer interest remains consistent, pointing to the ongoing appeal of attached homes in a competitive market.

Monthly Statistics for Townhouse/Rowhouse/TwinAll prices
Home Demand
Index
Index
90
(Steady)
Home Demand Index
from prior month
from prior month
93
Home Demand Index
from prior year
from prior year
94
Months of
Inventory
Inventory
2.9
Average daily inventory last month
2,805
Inventory sold
last month
last month
956
Bright MLS | T3 Home Demand Index
www.homedemandindex.com
Note
1. This report is generated with data from the following counties:
- Baltimore Metro – Anne Arundel, MD; Baltimore City, MD; Baltimore, MD; Carroll, MD; Harford, MD; Howard, MD;
- DelMar Coastal – Somerset, MD; Sussex, DE; Wicomico, MD; Worcester, MD;
- Maryland Eastern Shore – Caroline, MD; Cecil, MD; Dorchester, MD; Kent, MD; Queen Annes, MD; Talbot, MD;
2. This report is for the August 2025 period with data collected from the previous month.
Released: August 9, 2025
Reference ID: 2285
Baltimore | August 2025
Home Demand Map (Zip Codes)
Buyer activity across the Baltimore metro continues to show distinct regional differences. Howard County remains the most robust submarket, sustaining high demand levels, while Harford, Carroll, Anne Arundel, and Baltimore counties maintain steady buyer interest, suggesting healthy suburban engagement. Baltimore City, however, continues to lag with slow demand, reflecting ongoing affordability barriers and muted urban buyer confidence.

Bright MLS | T3 Home Demand Index
www.homedemandindex.com