Share report on Facebook!
Share on facebook
Share report on Twitter!
Share on twitter
Share report on LinkedIn!
Share on linkedin
Email a link to this Report!
Share on email
Download tile as an image.

Washington DC Metro | July 2026

Home Demand Index

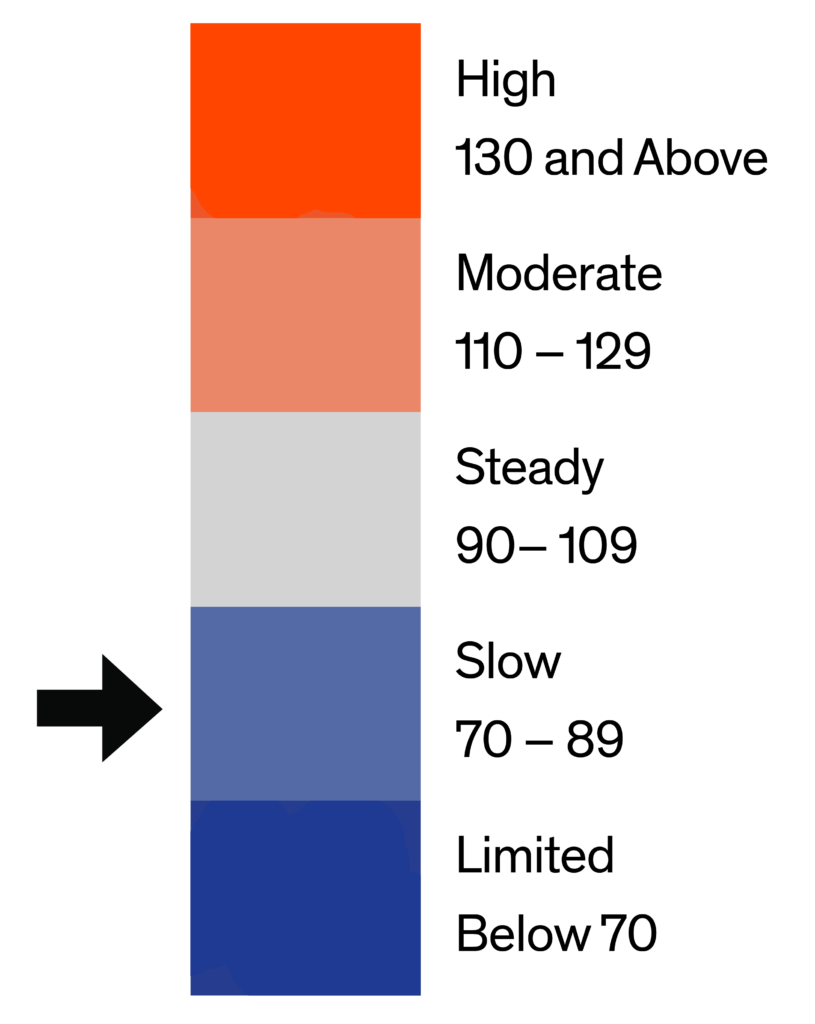
The Home Demand Index (HDI) for the Washington DC metro area stands at 85 for this report period, up one point from 84 last month and below the 99 recorded during the same period one year ago. The one-point month-over-month gain is operationally flat but directionally notable, July is historically one of the softer months in the DC metro’s seasonal demand cycle, and sustaining or improving on the June reading reflects the same late-closing dynamic visible in Baltimore, where buyers who acted during the rate-dip window in late spring are completing transactions into the July reporting period and extending the demand signal beyond the typical seasonal ceiling. Washington DC has held the regional leadership position for the fourth consecutive month, a pattern I attribute to the federal employment corridor that provides the core DC Metro buyer cohort with structural income stability that insulates demand from the financing cost sensitivity visible in more purely private-sector-driven markets. The fourteen-point year-over-year deficit, 85 now versus 99 in July 2025, is the widest annual gap among the three metros this period in absolute terms, but should be read in the context of what July 2025 represented for the DC market: an anomalously strong summer reading generated by an extended spring cycle during which federal employment stability and accumulated buyer urgency produced transactional activity well above the structural long-run pace. The current reading of 85 in a sustained 6.5-to-7-percent rate environment is not a sign of structural demand deterioration; it is a normalization from an above-trend baseline against a backdrop of genuine affordability pressure at the entry and mid single-family price points where the market’s highest buyer volume concentrates.
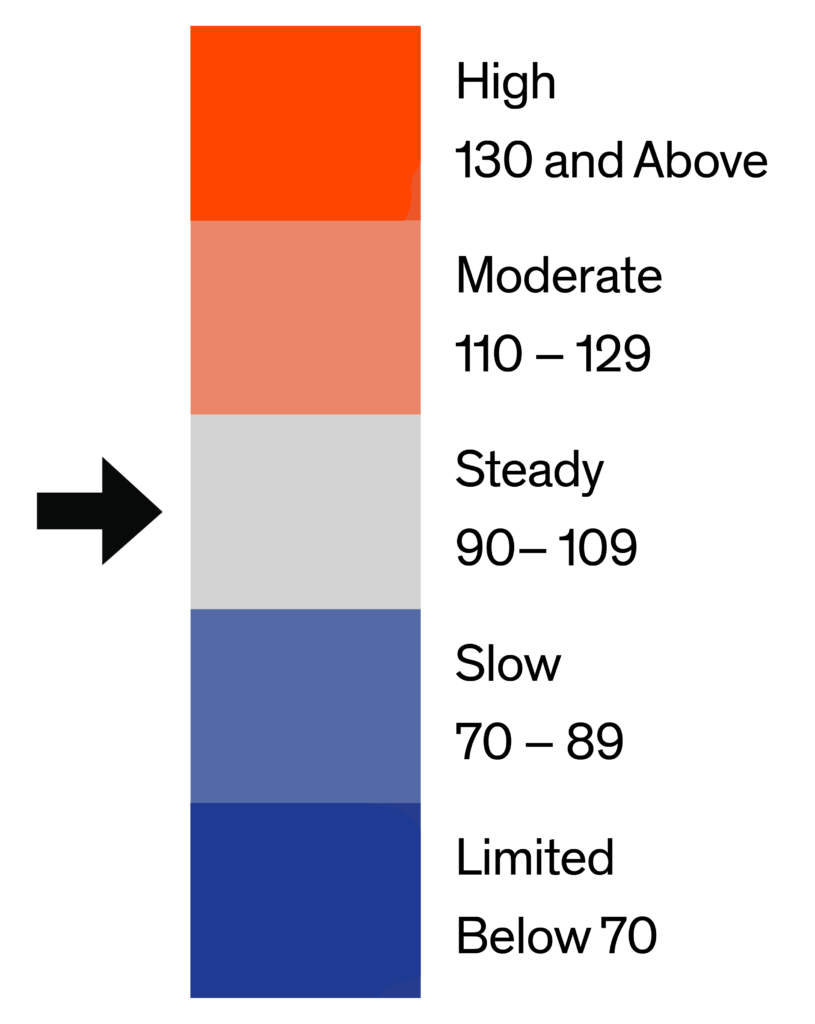
Demand by home type in Washington DC during this report period presents the most complex tier structure across the three metros, with meaningful divergence in both absolute level and direction across the six segments that collectively produce the 85-point metro average. The condo segments are running the strongest: entry condo at 104 and luxury condo at 109, the highest-indexed segment in the DC metro this period, have both extended gains from last month’s already-elevated readings, and both are in Steady territory, reflecting the sustained demand concentration in attached inventory that characterizes buyer behavior in a high-cost, high-density metro where the price efficiency of condo ownership is particularly compelling relative to detached single-family alternatives. Entry single-family at 77 and mid single-family at 77 are tracking at identical levels, a rare alignment that masks different directional signals: entry SF gained five points from last month while mid SF declined two points, suggesting divergent demand dynamics beneath the surface of a shared absolute index level. Luxury SF at 96, while still in Steady territory, registered the sharpest month-over-month decline of any segment in the DC metro at twelve points, signaling a meaningful deceleration in above-$1.4 million buyer engagement following an extended period of high-end transactional strength. Townhouse, rowhouse, and twin homes at 89 gained three points from last month, a constructive sequential improvement in the highest-volume attached format and a continuation of the counter-seasonal demand signal visible across the region’s attached segments.
Monthly Statistics for July 2026
Home Demand
Index
85
(Slow)
Home Demand Index
from prior month
84
Home Demand Index
from prior year
99
Index change
from prior month
1%
Index change from
same time last year
-14%
Bright MLS | T3 Home Demand Index

www.homedemandindex.com

Download tile as an image.
Embed this tile on your site.

Washington DC Metro | July 2026

Home Demand Index | Historical Year-over-Year Comparison

Over the past 12 months, the Washington DC metro’s Home Demand Index traced its most dynamic seasonal arc among the three markets covered in this report, sustaining readings in the low-to-mid 90s through July, August, and September before declining sharply through fall, reaching its seasonal floor of 54 in December, and then executing a pronounced recovery that reached 96 in March, surged to 103 in April, the highest reading in the trailing twelve-month window, before moderating to 84 in May, holding at 85 in June, and registering 85 again in the current July period. The duplication of the 85-point reading across June and July is a meaningful signal: like Philadelphia, the DC metro appears to have reached a near-term equilibrium point where the natural summer deceleration is being offset by residual late-closing buyer activity, resulting in a holding pattern at the upper end of the Slow range rather than the downward slope that would characterize a more typical July seasonal transition. At 85, the index trails the 99 posted at this point last year by fourteen points, a gap that is partly a function of the exceptional strength of July 2025 and partly a function of the degree to which the current period’s elevated financing costs are suppressing activity relative to a prior-year period when accumulated buyer urgency and rate-lock fatigue briefly produced a demand spike that pulled forward a meaningful portion of the summer transactional pipeline.

Home Demand Index

Bright MLS | T3 Home Demand Index

www.homedemandindex.com

Download the top-level Market Areas map as a screenshot.

Embed this tile on your site.

Washington DC Metro | July 2026

Home Demand Map

Regional demand across the Washington DC metro reflects a broadly stabilized picture this period, with the near-flat month-over-month reading at 85 maintaining the relative positioning of submarkets that has characterized the metro through the spring and early summer cycle. The Northern Virginia corridor, anchored by Arlington County, Falls Church City, and Alexandria City, continues to lead the metro in absolute demand levels, supported by the combination of dense federal contractor employment, established move-up buyer pipelines, and the income profile that sustains competitive demand for mid-to-upper single-family inventory in this corridor even as the broader market moderates. Fairfax County is tracking at Steady conditions, reflecting the balanced demand-supply dynamic in the county’s diverse price range inventory and the structural depth of its buyer base, while Loudoun County and Fairfax City are in Slow territory consistent with the broader metro reading. Washington DC proper is in Slow conditions, where affordability constraints in the urban core and the ongoing adjustment of the city’s professional buyer cohort to elevated price-and-rate conditions continue to moderate transactional pace. Montgomery County and Prince George’s County in Maryland are both in Slow territory, with Montgomery anchored by its own professional employment base and Prince George’s continuing to show the softness that has characterized the county throughout the current cycle. Frederick County registers the weakest demand at the metro’s outer Maryland ring, where affordability pressures, commute dynamics, and reduced urgency among outer-suburban buyers intersect to produce a Limited-range reading that reflects the structural challenge of sustaining demand at the periphery of a high-cost metro in a sustained elevated-rate environment.
Bright MLS | T3 Home Demand Index

www.homedemandindex.com

Download tile as an image.
Embed this tile on your site.

Washington DC Metro | July 2026

Demand and Inventory by Home Type

Demand by home type in Washington DC during this report period presents the most complex tier structure across the three metros, with meaningful divergence in both absolute level and direction across the six segments that collectively produce the 85-point metro average. The condo segments are running the strongest: entry condo at 104 and luxury condo at 109, the highest-indexed segment in the DC metro this period, have both extended gains from last month’s already-elevated readings, and both are in Steady territory, reflecting the sustained demand concentration in attached inventory that characterizes buyer behavior in a high-cost, high-density metro where the price efficiency of condo ownership is particularly compelling relative to detached single-family alternatives. Entry single-family at 77 and mid single-family at 77 are tracking at identical levels, a rare alignment that masks different directional signals: entry SF gained five points from last month while mid SF declined two points, suggesting divergent demand dynamics beneath the surface of a shared absolute index level. Luxury SF at 96, while still in Steady territory, registered the sharpest month-over-month decline of any segment in the DC metro at twelve points, signaling a meaningful deceleration in above-$1.4 million buyer engagement following an extended period of high-end transactional strength. Townhouse, rowhouse, and twin homes at 89 gained three points from last month, a constructive sequential improvement in the highest-volume attached format and a continuation of the counter-seasonal demand signal visible across the region’s attached segments.
Bright MLS | T3 Home Demand Index

www.homedemandindex.com

Download tile as an image.

Washington DC Metro | July 2026

The index for entry-level single-family homes in the Washington DC metro stands at 77 this report period, up five points from 72 last month and below the 85 recorded one year ago. The five-point month-over-month gain is the largest sequential improvement across any single-family tier in the DC metro this period and is a directionally constructive signal in the segment where affordability constraints are most acute, suggesting that a portion of buyers who had stepped back from the sub-$580,000 detached market in June have re-engaged in July, possibly as a function of the late-closing activity from spring decision-makers or as a response to modest price adjustments at the entry threshold that improve the financing calculus for this buyer cohort. At 2.5 months of inventory across 1,215 active listings and 482 monthly sales, supply conditions are moderate, more balanced than the sub-two-month readings observed in the mid-range and luxury segments, which reflects the degree to which the rate-lock effect is less pronounced at lower price points where the original entry decision was made at higher absolute prices and sellers are therefore more willing to list. The eight-point year-over-year shortfall from last year’s 85 is the narrowest annual gap across any SF tier in the DC metro this period, indicating that entry single-family demand has normalized most fully against its prior-year baseline among the detached categories.
Home Demand
Index
77
(Slow)
Home Demand Index
from prior month
72
Home Demand Index
from prior year
85
Months of
inventory
Average daily inventory last month
Inventory sold
last month
Bright MLS | T3 Home Demand Index

www.homedemandindex.com

Download tile as an image.

Washington DC Metro | July 2026

Mid-range single-family homes in the Washington DC metro registered an index of 77 this report period, down two points from 79 last month and below last year’s reading of 95. The two-point month-over-month decline is modest and suggests that mid-range demand in this metro has reached a near-term plateau in the upper-70s range following the spring recovery cycle, consistent with established households with equity-driven purchasing flexibility adopting a measured approach to the early-summer market rather than either accelerating or retreating meaningfully. The DC mid-range segment benefits from a structural demand floor provided by federal employment stability that tends to sustain transactional activity even in softer rate environments; the current two-point decline is therefore best read as a seasonal normalization rather than a deterioration in underlying demand fundamentals. At 1.7 months of inventory across 2,484 active listings and 1,480 monthly sales, the tightest supply reading of any segment in the DC metro this period, the mid-range tier is operating with the most constrained supply conditions in the market, which is simultaneously a supportive factor for the index and a potential headwind for volume, as buyers face a limited selection of properties in their preferred configuration and price range. The eighteen-point year-over-year shortfall from last July’s 95 is the widest among any non-luxury segment in the metro and reflects the elevated baseline set by DC’s unusually active mid-range market in summer 2025.
Home Demand
Index
77
(Slow)
Home Demand Index
from prior month
79
Home Demand Index
from prior year
95
Months of
Inventory
Average daily inventory last month
Inventory sold
last month
Bright MLS | T3 Home Demand Index

www.homedemandindex.com

Download tile as an image.

Washington DC Metro | July 2026

The index for luxury single-family homes in the Washington DC metro stands at 96 this report period, down twelve points from 108 last month and below last year’s reading of 131. The twelve-point month-over-month decline is the largest sequential retreat of any segment across any of the three metros covered in this report and signals a meaningful deceleration in above-$1.4 million buyer engagement in the DC market following an extended period of high-end transactional strength through the spring cycle. At 96, the segment remains in Steady territory, it has not fallen into the Slow range, but the rate of deceleration suggests that the luxury buyer cohort that was actively transacting through April and May has absorbed a meaningful portion of its near-term inventory of interest and is now adopting a more selective posture as the summer lifestyle calendar reduces market participation among this cohort. The thirty-five-point year-over-year shortfall from last July’s 131 is the widest annual gap across any tier in any of the three metros this period and is the most important single data point in the July DC report; it reflects the exceptional nature of summer 2025 DC luxury activity rather than a structural weakness in current conditions, but the magnitude of the gap is large enough that it will suppress the reported HDI for this segment throughout the summer months as the prior-year comparison remains elevated.
Home Demand
Index
96
(Steady)
Home Demand Index
from prior month
108
Home Demand Index
from prior year
131
Months of
Inventory
Average daily inventory last month
Inventory sold
last month
Bright MLS | T3 Home Demand Index

www.homedemandindex.com

Download tile as an image.

Washington DC Metro | July 2026

Entry-level condo demand in the Washington DC metro stands at 104 this report period, up seven points from 97 last month and below last year’s level of 117. The seven-point month-over-month gain pushes entry condo demand further into Steady territory and confirms the directional trend of the attached market outperforming detached single-family segments on both an absolute and sequential basis in the current environment. At 5.1 months of inventory across 3,125 active listings and 612 monthly sales, this segment carries the highest supply reading of any tier across the three metros covered in this report, a condition that typically suppresses demand index readings by providing buyers with meaningful selection flexibility and reduced urgency, which makes the 104-point Steady reading all the more significant as an indicator of genuine buyer conviction at the sub-$600,000 attached price point in the DC Metro. The combination of a high-inventory environment and a Steady-range demand index in the same segment indicates that the buyer pool at this price point is both large enough to sustain healthy absorption rates against a relatively well-supplied inventory base and motivated enough to transact without the urgency-compression that characterizes the tighter single-family supply environment. The thirteen-point year-over-year shortfall from last year’s 117 provides medium-term context, but the sequential direction and the absolute Steady reading are the more actionable near-term signals.
Home Demand
Index
104
(Steady)
Home Demand Index
from prior month
97
Home Demand Index
from prior year
117
Months of
Inventory
Average daily inventory last month
Inventory sold
last month
Bright MLS | T3 Home Demand Index

www.homedemandindex.com

This is Tooltip!

Washington DC Metro | July 2026

Luxury condo demand in the Washington DC metro registered 109 this report period, up twelve points from 97 last month and below last year’s level of 131. The twelve-point month-over-month gain is the most significant sequential improvement of any segment across the three metros this period and reflects the continuation of the counter-seasonal demand signal that has characterized the DC attached market through the June-to-July transition, driven by the downsizing, lifestyle-driven, and affluent urban buyer cohorts that define participation at the above-$600,000 attached price point in the DC metro. At 109, luxury condo demand is the highest-indexed segment in the Washington DC market this period and is in Steady territory, a result that underscores the structural appeal of premium attached inventory in a high-cost urban core where the combination of location, amenity access, and reduced maintenance responsibilities continues to attract a buyer pool with relatively limited financing sensitivity and a longer decision timeline than typical first-time or move-up buyers. The twenty-two-point year-over-year shortfall from last year’s 131 reflects the normalization from an exceptional prior-year luxury condo cycle in which DC’s urban premium market saw elevated transactional activity; at 4.2 months of inventory against 132 monthly sales, the current absorption pace is healthy relative to available supply and consistent with a functionally active market at this tier.
Home Demand
Index
109
(Steady)
Home Demand Index
from prior month
97
Home Demand Index
from prior year
131
Months of
Inventory
Average daily inventory last month
Inventory sold
last month
Bright MLS | T3 Home Demand Index

www.homedemandindex.com

This is Tooltip!

Washington DC Metro | July 2026

The index for townhouses, rowhouses, and twin homes in the Washington DC metro stands at 89 this report period, up three points from 86 last month and below last year’s level of 98. The three-point month-over-month gain continues the moderate sequential improvement that has characterized this segment through the spring-to-summer transition and represents the highest absolute reading among the single-family and attached single-family formats in the DC metro, with only the condo segments posting higher absolute index levels this period. At 2.4 months of inventory across 3,553 active listings and 1,476 monthly sales, the townhouse segment operates with supply conditions that are moderately constrained, tighter than the condo segments and broadly in line with the mid-range SF tier, which provides a structural support for demand index readings by limiting the degree to which buyers can adopt a passive wait-and-see approach. The segment’s enduring appeal in the DC metro, where the combination of space, outdoor access, and location efficiency within established commuter corridors continues to attract a broad and diverse buyer cohort, sustains demand through seasonal transitions that affect the more discretionary segments more acutely. The nine-point year-over-year shortfall from last year’s 98 is one of the narrower annual gaps in the DC metro this period and indicates that townhouse demand has normalized more fully against the prior-year baseline than the SF segments, particularly the luxury SF tier where the annual gap is thirty-five points.
Home Demand
Index
89
(Slow)
Home Demand Index
from prior month
86
Home Demand Index
from prior year
98
Months of
Inventory
Average daily inventory last month
Inventory sold
last month
Bright MLS | T3 Home Demand Index

www.homedemandindex.com

Note

2. This report is for the July 2026 period with data collected from the previous month.
Released: July 11, 2026
Reference ID: 2453

Washington DC Metro | July 2026

Home Demand Map (Zip Codes)

Regional demand across the Washington DC metro reflects a broadly stabilized picture this period, with the near-flat month-over-month reading at 85 maintaining the relative positioning of submarkets that has characterized the metro through the spring and early summer cycle. The Northern Virginia corridor, anchored by Arlington County, Falls Church City, and Alexandria City, continues to lead the metro in absolute demand levels, supported by the combination of dense federal contractor employment, established move-up buyer pipelines, and the income profile that sustains competitive demand for mid-to-upper single-family inventory in this corridor even as the broader market moderates. Fairfax County is tracking at Steady conditions, reflecting the balanced demand-supply dynamic in the county’s diverse price range inventory and the structural depth of its buyer base, while Loudoun County and Fairfax City are in Slow territory consistent with the broader metro reading. Washington DC proper is in Slow conditions, where affordability constraints in the urban core and the ongoing adjustment of the city’s professional buyer cohort to elevated price-and-rate conditions continue to moderate transactional pace. Montgomery County and Prince George’s County in Maryland are both in Slow territory, with Montgomery anchored by its own professional employment base and Prince George’s continuing to show the softness that has characterized the county throughout the current cycle. Frederick County registers the weakest demand at the metro’s outer Maryland ring, where affordability pressures, commute dynamics, and reduced urgency among outer-suburban buyers intersect to produce a Limited-range reading that reflects the structural challenge of sustaining demand at the periphery of a high-cost metro in a sustained elevated-rate environment.
Bright MLS | T3 Home Demand Index

www.homedemandindex.com

Embed the Timeline

To embed the map on your website, copy and paste the code below. Please note that the ideal dimensions for displaying the map are 1312 pixels wide by 660 pixels high.

Embed the Map

To embed the map on your website, copy and paste the code below. Please note that the ideal dimensions for displaying the map are 1312 pixels wide by 1182 pixels high.

Embed the Housing Type Bar Chart

To embed the map on your website, copy and paste the code below. Please note that the ideal dimensions for displaying the map are 1312 pixels wide by 880 pixels high.