Share report on Facebook!
Share on facebook
Share report on Twitter!
Share on twitter
Share report on LinkedIn!
Share on linkedin
Email a link to this Report!
Share on email
Download tile as an image.

Washington D.C. | August 2026

Home Demand Index

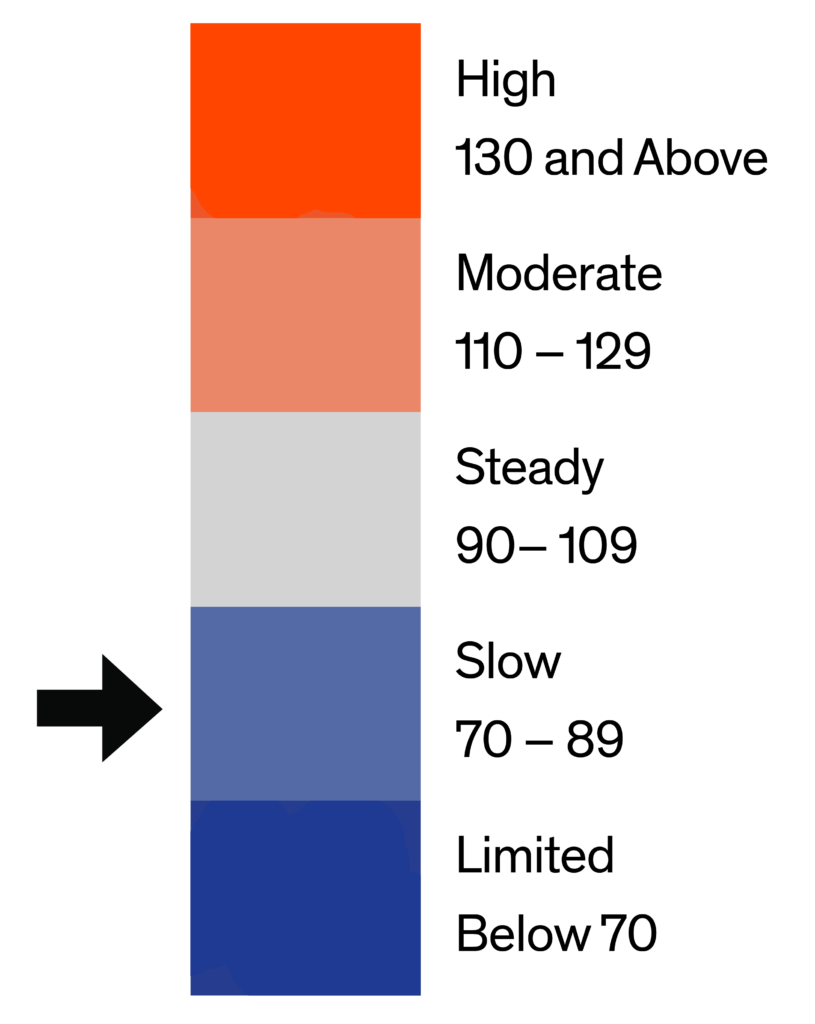
The Home Demand Index (HDI) for the Washington DC metro area stands at 88 for this report period, down one point from 89 last month and below the 93 recorded during the same period one year ago. Washington DC continues to hold the highest headline reading among the three metros covered in this report, though its lead over Baltimore has narrowed to just one point this period, the closest the two metros have run in recent months. The most significant development within the tier structure is the luxury single-family segment’s decline into Slow territory at 86, down thirteen points from 99 last month and twenty points below last year’s level of 106, a meaningful deceleration in above-$1.4 million buyer engagement that marks this tier’s first reading below the Steady threshold in several months.
Demand by home type in Washington DC this period is defined by the luxury single-family tier’s decline into Slow territory, down thirteen points to 86 and twenty points below a year ago, while luxury condo posted the largest month-over-month decline of any tier in this report, down sixteen points to 96 and twenty-one points below a year ago, though it remains Steady. Entry and mid single-family both eased modestly, down one point each to 80 and 79 respectively, while entry condo held largely steady at 107. Townhouse demand was the exception to the broader softening, up one point to 94 and up one point year-over-year, the only tier in the DC metro to post a positive annual comparison this period.
Monthly Statistics for August 2026
Home Demand
Index
88
(Slow)
Home Demand Index
from prior month
89
Home Demand Index
from prior year
93
Index change
from prior month
-1.1%
Index change from
same time last year
-5.4%
Bright MLS | T3 Home Demand Index

www.homedemandindex.com

Download tile as an image.
Embed this tile on your site.

Washington D.C. | August 2026

Home Demand Index | Historical Year-over-Year Comparison

Over the past 12 months, the Washington DC metro’s Home Demand Index traced its most dynamic seasonal arc among the three markets covered in this report, sustaining readings in the high 80s and low 90s through last August, September, and October before declining sharply through fall, reaching its seasonal floor of 54 in December, and then executing a pronounced recovery that peaked at 104 in April before easing to 85 in May and holding in the high 80s through June, July, and the current period. At 88, the index trails the 93 posted at this point last year by five points, a gap that has narrowed considerably from the double-digit deficits recorded earlier in the year. This reflects a market normalizing against a prior-year baseline that was itself only moderately elevated at this point in the cycle, rather than any acute new softening.

Home Demand Index

Bright MLS | T3 Home Demand Index

www.homedemandindex.com

Download the top-level Market Areas map as a screenshot.

Embed this tile on your site.

Washington D.C. | August 2026

Home Demand Map

Regional demand across the Washington DC metro continues to reflect its established geographic hierarchy, with Arlington County the clear leader at 139, in High territory, followed by Alexandria City at 117 in Moderate range, while Fairfax City, Fairfax County, Falls Church City, and Loudoun County are all in Steady territory between 94 and 104. Washington DC proper, Montgomery County, and Prince George’s County are all in Slow territory, ranging from 77 to 85, reflecting the more measured pace typical of these jurisdictions’ own professional employment bases. Frederick County remains the softest jurisdiction in the metro at 70, though notably improved from Limited territory in the prior report.
Bright MLS | T3 Home Demand Index

www.homedemandindex.com

Download tile as an image.
Embed this tile on your site.

Washington D.C. | August 2026

Demand and Inventory by Home Type

Demand by home type in Washington DC this period is defined by the luxury single-family tier’s decline into Slow territory, down thirteen points to 86 and twenty points below a year ago, while luxury condo posted the largest month-over-month decline of any tier in this report, down sixteen points to 96 and twenty-one points below a year ago, though it remains Steady. Entry and mid single-family both eased modestly, down one point each to 80 and 79 respectively, while entry condo held largely steady at 107. Townhouse demand was the exception to the broader softening, up one point to 94 and up one point year-over-year, the only tier in the DC metro to post a positive annual comparison this period.
Bright MLS | T3 Home Demand Index

www.homedemandindex.com

Download tile as an image.

Washington D.C. | August 2026

Single Family Home Below $580k

The index for entry-level single-family homes in Washington DC stands at 80 this report period, down one point from 81 last month and below the 83 recorded one year ago. The modest three-point year-over-year shortfall is among the narrower annual gaps in this metro’s tier structure, suggesting that below-$580,000 buyer demand has largely stabilized against its prior-year baseline even as other segments in the metro show wider comparisons. At 3.0 months of inventory across 1,351 active listings and 455 monthly sales, supply conditions are moderate relative to the tighter readings observed in the mid-range tier.
Monthly Statistics for Single Family Home Below $580k
Home Demand
Index
80
(Slow)
Home Demand Index
from prior month
81
Home Demand Index
from prior year
83
Months of
inventory
3.0
Average daily inventory last month
1,351
Inventory sold
last month
455
Bright MLS | T3 Home Demand Index

www.homedemandindex.com

Download tile as an image.

Washington D.C. | August 2026

Single Family Home $580k - $1400k

Mid-range single-family homes in the Washington DC metro registered an index of 79 this report period, down one point from 80 last month and below last year’s reading of 90. The eleven-point year-over-year shortfall is a meaningful gap for this volume tier, though the modest sequential decline suggests the softening has been gradual rather than sudden. At 2.1 months of inventory across 2,688 active listings and 1,264 monthly sales, this tier continues to operate with tight supply conditions relative to the metro’s other single-family segments.
Monthly Statistics for Single Family Home $580k - $1400k
Home Demand
Index
79
(Slow)
Home Demand Index
from prior month
80
Home Demand Index
from prior year
90
Months of
Inventory
2.1
Average daily inventory last month
2,688
Inventory sold
last month
1,264
Bright MLS | T3 Home Demand Index

www.homedemandindex.com

Download tile as an image.

Washington D.C. | August 2026

Single Family Home Above $1400k

The index for luxury single-family homes in Washington DC stands at 86 this report period, down thirteen points from 99 last month and twenty points below last year’s reading of 106. This is the most significant sequential decline of any tier in this report and marks the first period in several months that this segment has registered below the Steady threshold, a meaningful deceleration in above-$1.4 million buyer engagement. At 2.9 months of inventory across 928 active listings and 319 monthly sales, supply conditions have loosened somewhat as buyer engagement at this price point has cooled.
Monthly Statistics for Single Family Home Above $1400k
Home Demand
Index
86
(Slow)
Home Demand Index
from prior month
99
Home Demand Index
from prior year
106
Months of
Inventory
2.9
Average daily inventory last month
928
Inventory sold
last month
319
Bright MLS | T3 Home Demand Index

www.homedemandindex.com

Download tile as an image.

Washington D.C. | August 2026

Condo Below $600k

Entry-level condo demand in Washington DC stands at 107 this report period, down two points from 109 last month and below last year’s level of 110. The essentially stable reading keeps this segment comfortably in Steady territory, and the three-point year-over-year shortfall is the narrowest annual gap of any tier in this metro. At 5.3 months of inventory across 3,344 active listings and 633 monthly sales, this segment carries the highest supply reading of any tier in this metro, providing buyers with meaningful selection even as the index holds steady.
Monthly Statistics for Condo Below $600k
Home Demand
Index
107
(Steady)
Home Demand Index
from prior month
109
Home Demand Index
from prior year
110
Months of
Inventory
5.3
Average daily inventory last month
3,344
Inventory sold
last month
633
Bright MLS | T3 Home Demand Index

www.homedemandindex.com

This is Tooltip!

Washington D.C. | August 2026

Condo Above $600k

Luxury condo demand in Washington DC registered 96 this report period, down sixteen points from 112 last month and below last year’s level of 117. The sixteen-point month-over-month decline is a significant sequential move, though this tier remains in Steady territory even after the pullback. The twenty-one-point year-over-year shortfall is consistent with the broader softening observed at the higher end of the Washington DC market this period, most notably in the luxury single-family tier.
Monthly Statistics for Condo Above $600k
Home Demand
Index
96
(Steady)
Home Demand Index
from prior month
112
Home Demand Index
from prior year
117
Months of
Inventory
4.0
Average daily inventory last month
520
Inventory sold
last month
129
Bright MLS | T3 Home Demand Index

www.homedemandindex.com

This is Tooltip!

Washington D.C. | August 2026

Townhouse/Rowhouse/Twin All prices

Townhouse/
Rowhouse/Twin
All prices

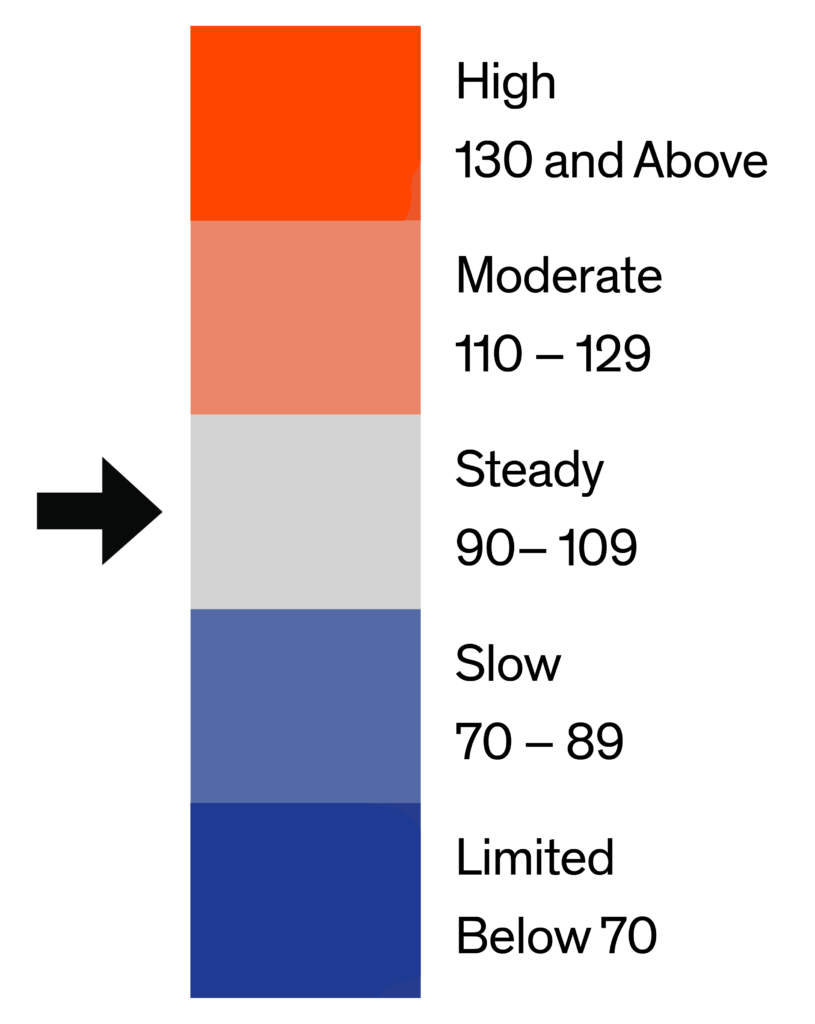
The index for townhouses, rowhouses, and twin homes in Washington DC stands at 94 this report period, up one point from 93 last month and up one point from last year’s level of 93. This is the only tier in the Washington DC metro to register a positive year-over-year comparison this period, a notable point of stability even as the luxury tiers soften considerably. At 2.9 months of inventory across 3,908 active listings and 1,338 monthly sales, this remains one of the highest-volume tiers in the metro, and its continued strength is a constructive signal for the broader market’s underlying health.
Monthly Statistics for Townhouse/Rowhouse/TwinAll prices
Home Demand
Index
94
(Steady)
Home Demand Index
from prior month
93
Home Demand Index
from prior year
93
Months of
Inventory
2.9
Average daily inventory last month
3,908
Inventory sold
last month
1,338
Bright MLS | T3 Home Demand Index

www.homedemandindex.com

Note

1. This report is generated with data from the following counties:
  • Maryland-West Virginia Panhandle – Allegany, MD; Berkeley, WV; Garrett, MD; Grant, WV; Hampshire, WV; Hardy, WV; Jefferson, WV; Mineral, WV; Morgan, WV; Pendleton, WV; Washington, MD;
  • North Central Virginia – Caroline, VA; Clarke, VA; Culpeper, VA; Fauquier, VA; Frederick, VA; Fredericksburg City, VA; King George, VA; Madison, VA; Manassas City, VA; Orange, VA; Page, VA; Prince William, VA; Rappahannock, VA; Shenandoah, VA; Spotsylvania, VA; Stafford, VA; Warren, VA; Winchester City, VA;
  • Southern Maryland – Calvert, MD; Charles, MD; Saint Marys, MD;
  • Washington D.C. Metro – Alexandria City, VA; Arlington, VA; Fairfax, VA; Falls Church City, VA; Frederick, MD; Loudoun, VA; Montgomery, MD; Prince Georges, MD; Washington, DC;

2. This report is for the August 2026 period with data collected from the previous month.
Released: August 10, 2026
Reference ID: 2472

Washington D.C. | August 2026

Home Demand Map (Zip Codes)

Regional demand across the Washington DC metro continues to reflect its established geographic hierarchy, with Arlington County the clear leader at 139, in High territory, followed by Alexandria City at 117 in Moderate range, while Fairfax City, Fairfax County, Falls Church City, and Loudoun County are all in Steady territory between 94 and 104. Washington DC proper, Montgomery County, and Prince George’s County are all in Slow territory, ranging from 77 to 85, reflecting the more measured pace typical of these jurisdictions’ own professional employment bases. Frederick County remains the softest jurisdiction in the metro at 70, though notably improved from Limited territory in the prior report.
Bright MLS | T3 Home Demand Index

www.homedemandindex.com

Embed the Timeline

To embed the map on your website, copy and paste the code below. Please note that the ideal dimensions for displaying the map are 1312 pixels wide by 660 pixels high.

Embed the Map

To embed the map on your website, copy and paste the code below. Please note that the ideal dimensions for displaying the map are 1312 pixels wide by 1182 pixels high.

Embed the Housing Type Bar Chart

To embed the map on your website, copy and paste the code below. Please note that the ideal dimensions for displaying the map are 1312 pixels wide by 880 pixels high.