Share report on Facebook!
Share on facebook
Share report on Twitter!
Share on twitter
Share report on LinkedIn!
Share on linkedin
Email a link to this Report!
Share on email
Download tile as an image.

Philadelphia | September 2026

Home Demand Index

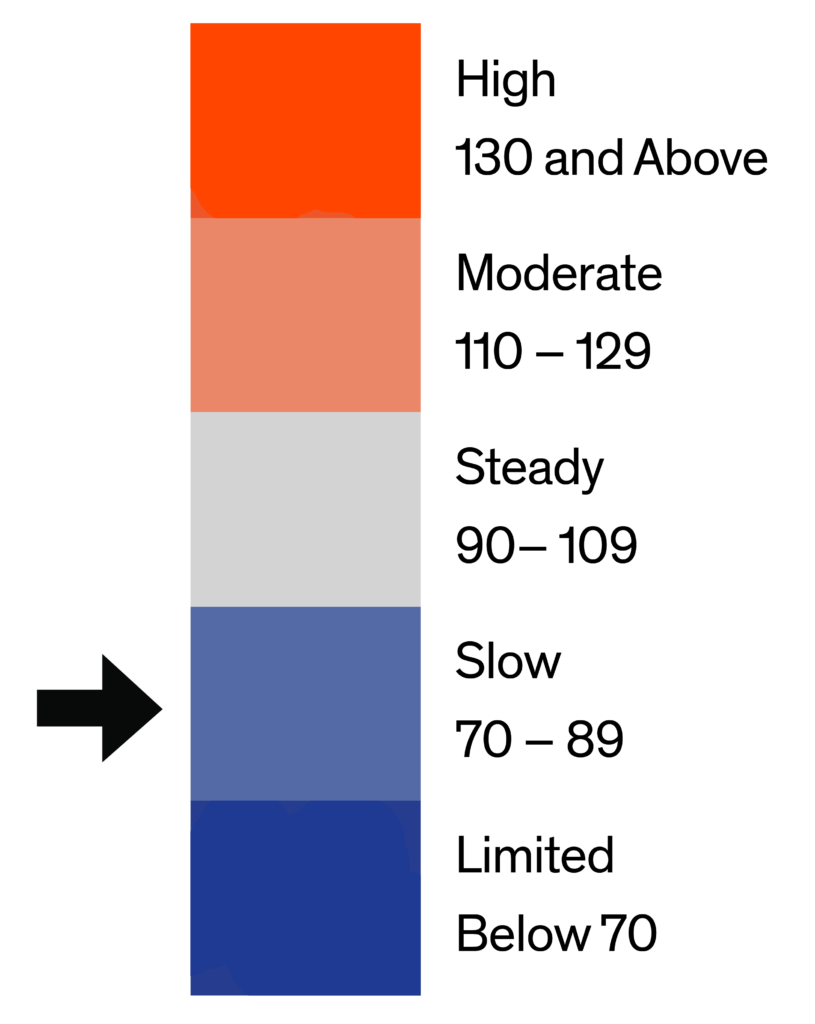
The Home Demand Index (HDI) for the Philadelphia metro area stands at 77 for this report period, down 5 points from last month’s 82 and below the 79 recorded one year ago. That leaves the market 6.1% lower on the month and 2.5% lower than a year ago, a broad-based cooling that carries a Slow demand rating heading into the fall. The pullback is consistent across most home-type and price tiers rather than concentrated in any single segment, pointing to rate-and-affordability fatigue rather than a localized shift.
Demand by home type in Philadelphia this period ranges from a high of 97 in the entry-level condo tier to a low of 60 in the luxury single-family tier, with most segments softening month over month. The condo tiers continue to screen strongest on the index, while single-family demand sits lower, a pattern driven by the affordability advantage condos hold at their price points. Entry single-family remains the most payment-sensitive tier at 76 (Slow), and mid-range single-family sits at 71. Luxury single-family reads 60 and the townhouse/rowhouse format 85, both easing on the month. Inventory generally sits in the two-to-five-month range across tiers, keeping the metro balanced-to-soft rather than tight.
Monthly Statistics for September 2026
Home Demand
Index
77
(Slow)
Home Demand Index
from prior month
82
Home Demand Index
from prior year
79
Index change
from prior month
-6.1%
Index change from
same time last year
-2.5%
Bright MLS | T3 Home Demand Index

www.homedemandindex.com

Download tile as an image.
Embed this tile on your site.

Philadelphia | September 2026

Home Demand Index | Historical Year-over-Year Comparison

Over the trailing twelve months, Philadelphia’s Home Demand Index followed a clear seasonal arc, easing through the fall to a low of 47 in December before recovering through the winter to a spring peak of 89 in April. It has since drifted lower through the summer to the current 77, tracking below the prior-year path, which ran from 79 a year ago to 82 last month. The year-over-year gap has widened as the market moved into late summer, underscoring that this cycle’s demand is running cooler than the comparable stretch of 2024-25.

Home Demand Index

Bright MLS | T3 Home Demand Index

www.homedemandindex.com

Download the top-level Market Areas map as a screenshot.

Embed this tile on your site.

Philadelphia | September 2026

Home Demand Map

Demand across the Philadelphia metro continues to reflect its established geographic structure, spanning core counties such as Bucks, Burlington, Camden, Chester, Delaware, Gloucester, Montgomery, New Castle and Philadelphia. Buyer activity remains firmest in the higher-income, supply-constrained submarkets and softest where entry-level affordability is most stretched, a divergence that has held steady even as the metro-wide index has cooled. The overall Slow reading masks that internal spread, with individual submarkets sitting on either side of the metro average.
Bright MLS | T3 Home Demand Index

www.homedemandindex.com

Download tile as an image.
Embed this tile on your site.

Philadelphia | September 2026

Demand and Inventory by Home Type

Demand by home type in Philadelphia this period ranges from a high of 97 in the entry-level condo tier to a low of 60 in the luxury single-family tier, with most segments softening month over month. The condo tiers continue to screen strongest on the index, while single-family demand sits lower, a pattern driven by the affordability advantage condos hold at their price points. Entry single-family remains the most payment-sensitive tier at 76 (Slow), and mid-range single-family sits at 71. Luxury single-family reads 60 and the townhouse/rowhouse format 85, both easing on the month. Inventory generally sits in the two-to-five-month range across tiers, keeping the metro balanced-to-soft rather than tight.
Bright MLS | T3 Home Demand Index

www.homedemandindex.com

Download tile as an image.

Philadelphia | September 2026

Single Family Home Below $370k

The index for entry-level single-family homes in Philadelphia (below $370,000) stands at 76 this report period, down 1 point from last month’s 77 and below the 85 recorded a year ago. That keeps the tier in Slow territory, with roughly 2.5 months of inventory across 1,442 active listings and 582 sales last month. The year-over-year decline signals demand running cooler than the same period last cycle at this price point.
Monthly Statistics for Single Family Home Below $370k
Home Demand
Index
76
(Slow)
Home Demand Index
from prior month
77
Home Demand Index
from prior year
85
Months of
inventory
2.5
Average daily inventory last month
1,442
Inventory sold
last month
582
Bright MLS | T3 Home Demand Index

www.homedemandindex.com

Download tile as an image.

Philadelphia | September 2026

Single Family Home $370k - $820k

The index for mid-range single-family homes in Philadelphia ($370,000 to $820,000) stands at 71 this report period, down 7 points from last month’s 78 and below the 73 recorded a year ago. That keeps the tier in Slow territory, with roughly 1.9 months of inventory across 3,684 active listings and 1,908 sales last month. The year-over-year decline signals demand running cooler than the same period last cycle at this price point.
Monthly Statistics for Single Family Home $370k - $820k
Home Demand
Index
71
(Slow)
Home Demand Index
from prior month
78
Home Demand Index
from prior year
73
Months of
Inventory
1.9
Average daily inventory last month
3,684
Inventory sold
last month
1,908
Bright MLS | T3 Home Demand Index

www.homedemandindex.com

Download tile as an image.

Philadelphia | September 2026

Single Family Home Above $820k

The index for luxury single-family homes in Philadelphia (above $820,000) stands at 60 this report period, down 12 points from last month’s 72 and above the 58 recorded a year ago. That keeps the tier in Limited territory, with roughly 2.5 months of inventory across 1,373 active listings and 543 sales last month. The year-over-year gain signals demand holding up against the same period last cycle at this price point.
Monthly Statistics for Single Family Home Above $820k
Home Demand
Index
60
(Limited)
Home Demand Index
from prior month
72
Home Demand Index
from prior year
58
Months of
Inventory
2.5
Average daily inventory last month
1,373
Inventory sold
last month
543
Bright MLS | T3 Home Demand Index

www.homedemandindex.com

Download tile as an image.

Philadelphia | September 2026

Condo Below $430k

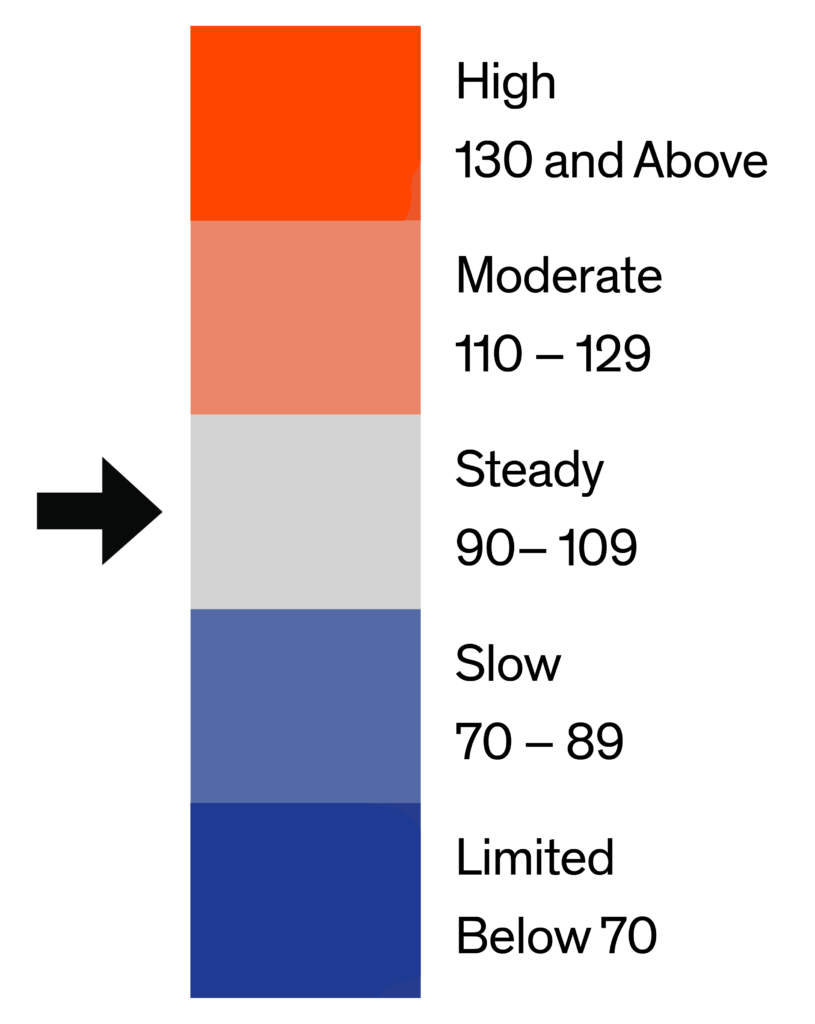
The index for entry-level condominium homes in Philadelphia (below $430,000) stands at 97 this report period, down 10 points from last month’s 107 and below the 101 recorded a year ago. That keeps the tier in Steady territory, with roughly 4.8 months of inventory across 1,230 active listings and 258 sales last month. The year-over-year decline signals demand running cooler than the same period last cycle at this price point.
Monthly Statistics for Condo Below $430k
Home Demand
Index
97
(Steady)
Home Demand Index
from prior month
107
Home Demand Index
from prior year
101
Months of
Inventory
4.8
Average daily inventory last month
1,230
Inventory sold
last month
258
Bright MLS | T3 Home Demand Index

www.homedemandindex.com

This is Tooltip!

Philadelphia | September 2026

Condo Above $430k

The index for luxury condominium homes in Philadelphia (above $430,000) stands at 90 this report period, down 5 points from last month’s 95 and below the 103 recorded a year ago. That keeps the tier in Steady territory, with roughly 4.8 months of inventory across 281 active listings and 59 sales last month. The year-over-year decline signals demand running cooler than the same period last cycle at this price point.
Monthly Statistics for Condo Above $430k
Home Demand
Index
90
(Steady)
Home Demand Index
from prior month
95
Home Demand Index
from prior year
103
Months of
Inventory
4.8
Average daily inventory last month
281
Inventory sold
last month
59
Bright MLS | T3 Home Demand Index

www.homedemandindex.com

This is Tooltip!

Philadelphia | September 2026

Townhouse/Rowhouse/Twin All prices

Townhouse/
Rowhouse/Twin
All prices

The index for townhouses, rowhouses and twins in Philadelphia (all prices) stands at 85 this report period, down 4 points from last month’s 89 and below the 86 of a year ago. The tier sits in Slow territory with about 4.1 months of inventory across 7,677 active listings and 1,892 sales last month. As the metro’s highest-volume attached format, it typically tracks close to the overall market, and this period is no exception at 85 against the metro’s 77.
Monthly Statistics for Townhouse/Rowhouse/TwinAll prices
Home Demand
Index
85
(Slow)
Home Demand Index
from prior month
89
Home Demand Index
from prior year
86
Months of
Inventory
4.1
Average daily inventory last month
7,677
Inventory sold
last month
1,892
Bright MLS | T3 Home Demand Index

www.homedemandindex.com

Note

1. This report is generated with data from the following counties:
  • Central Pennsylvania – Adams, PA; Berks, PA; Cumberland, PA; Dauphin, PA; Franklin, PA; Fulton, PA; Lancaster, PA; Lebanon, PA; Perry, PA; Schuylkill, PA; York, PA;
  • Ocean County – Ocean, NJ;
  • Philadelphia Metro – Bucks, PA; Burlington, NJ; Camden, NJ; Chester, PA; Delaware, PA; Gloucester, NJ; Kent, DE; Mercer, NJ; Montgomery, PA; New Castle, DE; Philadelphia, PA;
  • Salem-Cumberland – Cumberland, NJ; Salem, NJ;

2. This report is for the September 2026 period with data collected from the previous month.
Released: September 11, 2026
Reference ID: 2486

Philadelphia | September 2026

Home Demand Map (Zip Codes)

Demand across the Philadelphia metro continues to reflect its established geographic structure, spanning core counties such as Bucks, Burlington, Camden, Chester, Delaware, Gloucester, Montgomery, New Castle and Philadelphia. Buyer activity remains firmest in the higher-income, supply-constrained submarkets and softest where entry-level affordability is most stretched, a divergence that has held steady even as the metro-wide index has cooled. The overall Slow reading masks that internal spread, with individual submarkets sitting on either side of the metro average.
Bright MLS | T3 Home Demand Index

www.homedemandindex.com

Embed the Timeline

To embed the map on your website, copy and paste the code below. Please note that the ideal dimensions for displaying the map are 1312 pixels wide by 660 pixels high.

Embed the Map

To embed the map on your website, copy and paste the code below. Please note that the ideal dimensions for displaying the map are 1312 pixels wide by 1182 pixels high.

Embed the Housing Type Bar Chart

To embed the map on your website, copy and paste the code below. Please note that the ideal dimensions for displaying the map are 1312 pixels wide by 880 pixels high.