Share report on Facebook!
Share on facebook
Share report on Twitter!
Share on twitter
Share report on LinkedIn!
Share on linkedin
Email a link to this Report!
Share on email
Download tile as an image.

Philadelphia | October 2026

Home Demand Index

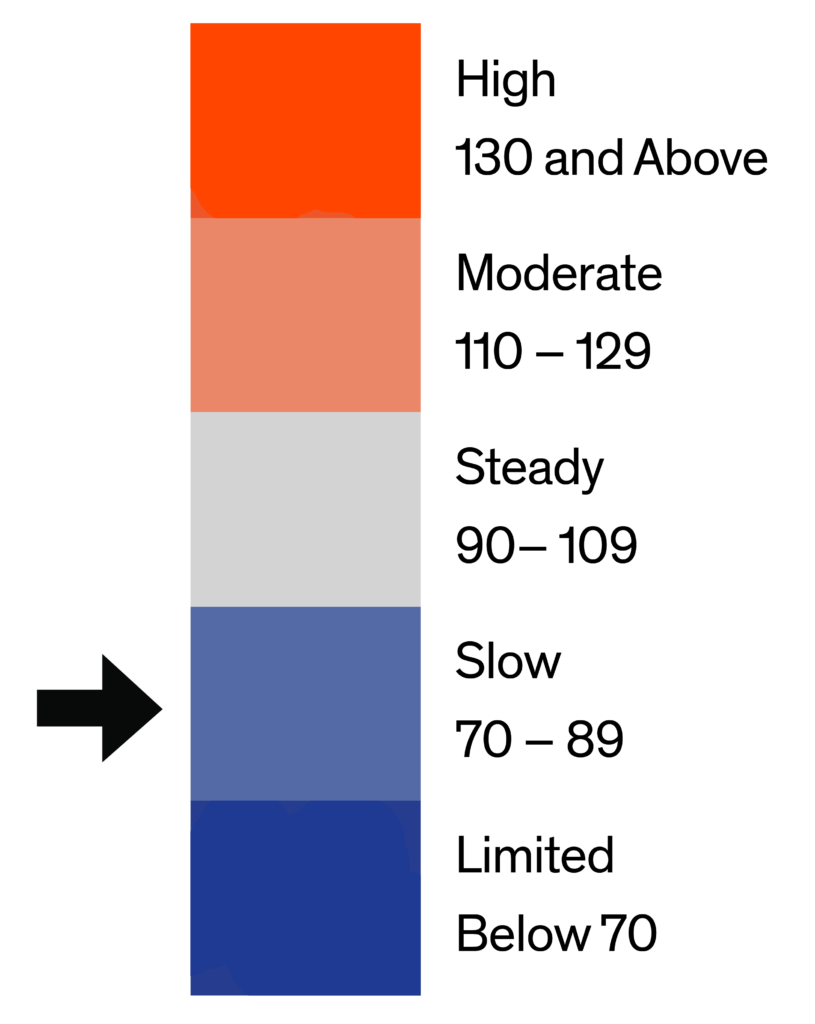
The Home Demand Index (HDI) for the Philadelphia metro area stands at 78 for this report period, unchanged from last month’s 78 and below the 84 recorded one year ago. That leaves the market flat on the month and 7.1% lower than a year ago, holding a Slow demand rating as the fall season begins. Beneath the steady headline, the tiers moved in opposite directions: luxury single-family and luxury condo demand rose on the month, while the entry and mid-range single-family and entry condo tiers softened.
Demand by home type in Philadelphia this period ranges from a high of 110 in the luxury condo tier to a low of 67 in the luxury single-family tier. Luxury condos jumped 20 points on the month to 110 (Moderate), and entry condos read 95 (Steady), keeping the condo tiers on top. Single-family demand is weaker across the board: entry at 76 (Slow), mid-range at 69 (Limited) and luxury at 67 (Limited), although luxury single-family gained 6 points on the month. The townhouse/rowhouse format, the metro’s largest segment, held at 87. Inventory runs from about 2.4 months in mid-range single-family to 6.0 months in luxury condos, a balanced-to-soft supply picture overall.
Monthly Statistics for October 2026
Home Demand
Index
78
(Slow)
Home Demand Index
from prior month
78
Home Demand Index
from prior year
84
Index change
from prior month
0.0%
Index change from
same time last year
-7.1%
Bright MLS | T3 Home Demand Index

www.homedemandindex.com

Download tile as an image.
Embed this tile on your site.

Philadelphia | October 2026

Home Demand Index | Historical Year-over-Year Comparison

Over the trailing twelve months, Philadelphia’s Home Demand Index followed its usual seasonal arc, easing through the fall to a low of 47 in December before recovering to a spring peak of 89 in April. It has since settled in the high 70s and low 80s through the summer, reaching the current 78, below the prior-year level of 84 a year ago. The current 6-point year-over-year gap is wider than in July and August, signaling that late-summer demand is running modestly cooler than the comparable stretch of 2025.

Home Demand Index

Bright MLS | T3 Home Demand Index

www.homedemandindex.com

Download the top-level Market Areas map as a screenshot.

Embed this tile on your site.

Philadelphia | October 2026

Home Demand Map

Demand across the Philadelphia metro reflects a broad, multi-state footprint spanning Bucks, Chester, Delaware, Montgomery and Philadelphia counties in Pennsylvania; Burlington, Camden, Gloucester and Mercer counties in New Jersey; and Kent and New Castle counties in Delaware. Buyer activity remains firmest across the Pennsylvania and Delaware submarkets and softest across the New Jersey counties, a spread that has held as the metro-wide index has leveled off. The overall Slow reading of 78 masks that internal variation, with individual counties sitting on either side of the metro average.
Bright MLS | T3 Home Demand Index

www.homedemandindex.com

Download tile as an image.
Embed this tile on your site.

Philadelphia | October 2026

Demand and Inventory by Home Type

Demand by home type in Philadelphia this period ranges from a high of 110 in the luxury condo tier to a low of 67 in the luxury single-family tier. Luxury condos jumped 20 points on the month to 110 (Moderate), and entry condos read 95 (Steady), keeping the condo tiers on top. Single-family demand is weaker across the board: entry at 76 (Slow), mid-range at 69 (Limited) and luxury at 67 (Limited), although luxury single-family gained 6 points on the month. The townhouse/rowhouse format, the metro’s largest segment, held at 87. Inventory runs from about 2.4 months in mid-range single-family to 6.0 months in luxury condos, a balanced-to-soft supply picture overall.
Bright MLS | T3 Home Demand Index

www.homedemandindex.com

Download tile as an image.

Philadelphia | October 2026

Single Family Home Below $375k

The index for entry-level single-family homes in Philadelphia (below $375,000) stands at 76 this report period, down 4 points from last month’s 80 and below the 87 recorded a year ago. That places the tier in Slow territory, with roughly 2.7 months of inventory across 1,511 active listings and 562 sales last month. Softer readings on both the monthly and annual comparisons point to demand running cooler than the same period last cycle at this price point.
Monthly Statistics for Single Family Home Below $375k
Home Demand
Index
76
(Slow)
Home Demand Index
from prior month
80
Home Demand Index
from prior year
87
Months of
inventory
2.7
Average daily inventory last month
1,511
Inventory sold
last month
562
Bright MLS | T3 Home Demand Index

www.homedemandindex.com

Download tile as an image.

Philadelphia | October 2026

Single Family Home $375k - $826k

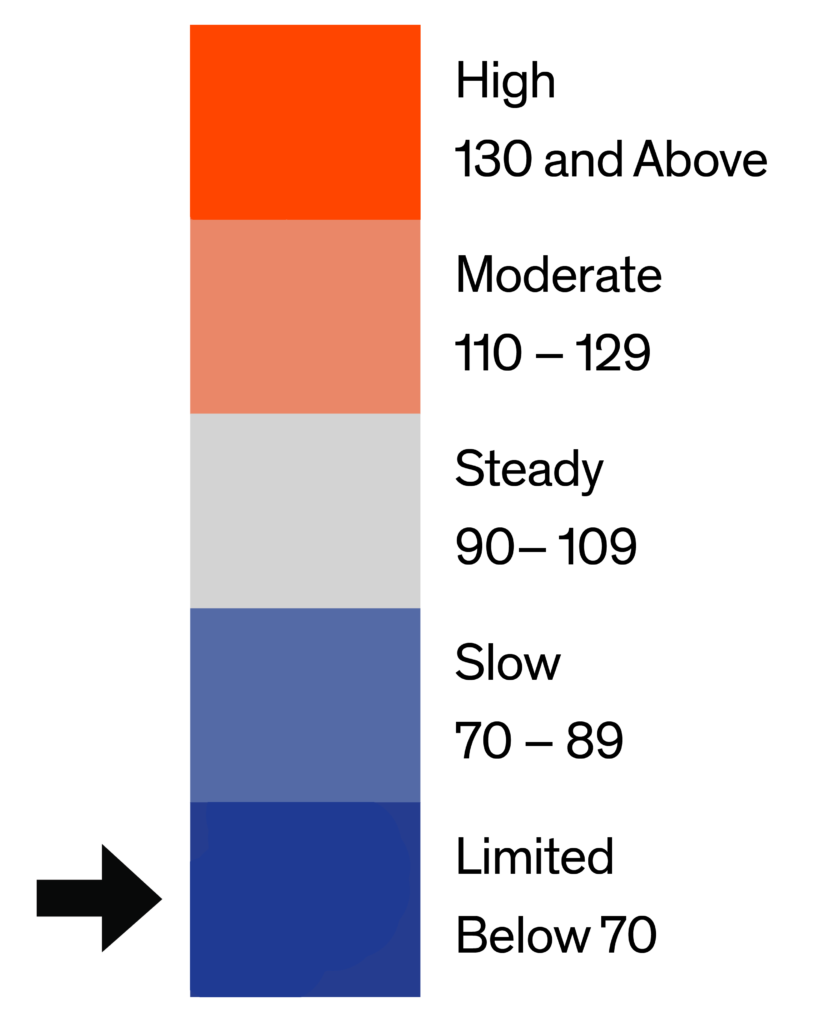
The index for mid-range single-family homes in Philadelphia ($375,000 to $826,000) stands at 69 this report period, down 3 points from last month’s 72 and below the 76 recorded a year ago. That places the tier in Limited territory, with roughly 2.4 months of inventory across 3,694 active listings and 1,541 sales last month. Softer readings on both the monthly and annual comparisons point to demand running cooler than the same period last cycle at this price point.
Monthly Statistics for Single Family Home $375k - $826k
Home Demand
Index
69
(Limited)
Home Demand Index
from prior month
72
Home Demand Index
from prior year
76
Months of
Inventory
2.4
Average daily inventory last month
3,694
Inventory sold
last month
1,541
Bright MLS | T3 Home Demand Index

www.homedemandindex.com

Download tile as an image.

Philadelphia | October 2026

Single Family Home Above $826k

The index for luxury single-family homes in Philadelphia (above $826,000) stands at 67 this report period, up 6 points from last month’s 61 and below the 70 recorded a year ago. That places the tier in Limited territory, with roughly 3.6 months of inventory across 1,355 active listings and 380 sales last month. The monthly gain is encouraging, but demand remains below last year’s pace at this price point, so the rebound has not yet closed the annual gap.
Monthly Statistics for Single Family Home Above $826k
Home Demand
Index
67
(Limited)
Home Demand Index
from prior month
61
Home Demand Index
from prior year
70
Months of
Inventory
3.6
Average daily inventory last month
1,355
Inventory sold
last month
380
Bright MLS | T3 Home Demand Index

www.homedemandindex.com

Download tile as an image.

Philadelphia | October 2026

Condo Below $435k

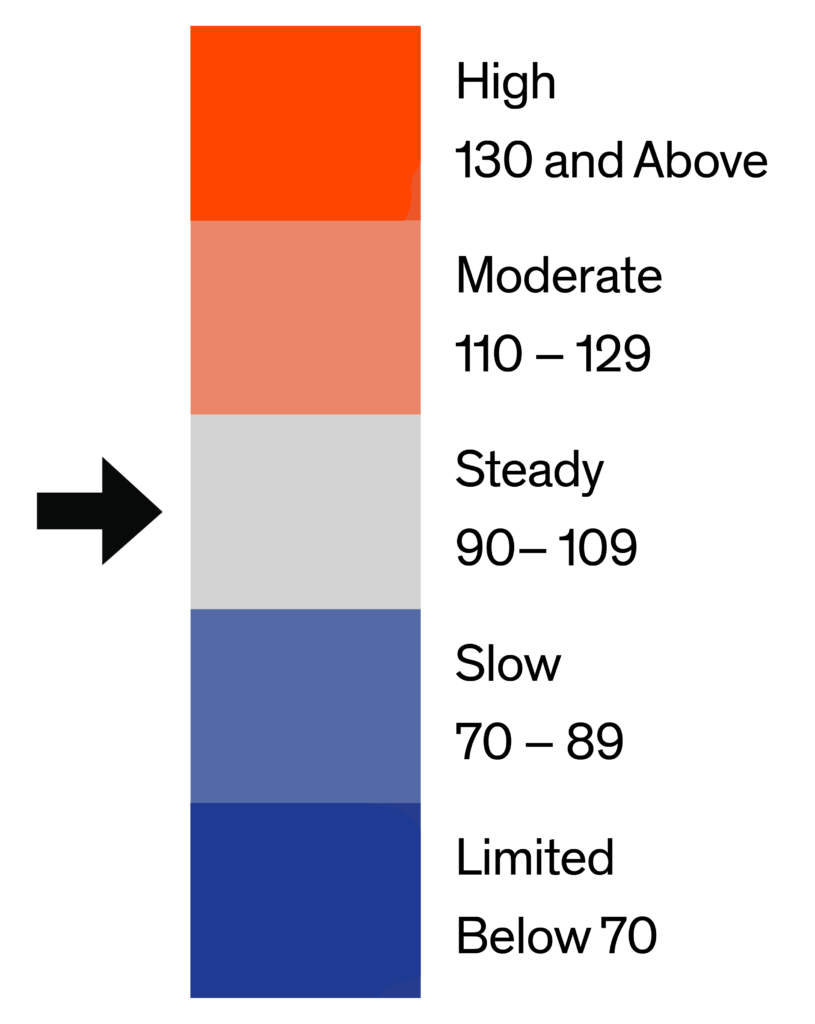
The index for entry-level condominium homes in Philadelphia (below $435,000) stands at 95 this report period, down 4 points from last month’s 99 and below the 108 recorded a year ago. That places the tier in Steady territory, with roughly 4.9 months of inventory across 1,235 active listings and 254 sales last month. Softer readings on both the monthly and annual comparisons point to demand running cooler than the same period last cycle at this price point.
Monthly Statistics for Condo Below $435k
Home Demand
Index
95
(Steady)
Home Demand Index
from prior month
99
Home Demand Index
from prior year
108
Months of
Inventory
4.9
Average daily inventory last month
1,235
Inventory sold
last month
254
Bright MLS | T3 Home Demand Index

www.homedemandindex.com

This is Tooltip!

Philadelphia | October 2026

Condo Above $435k

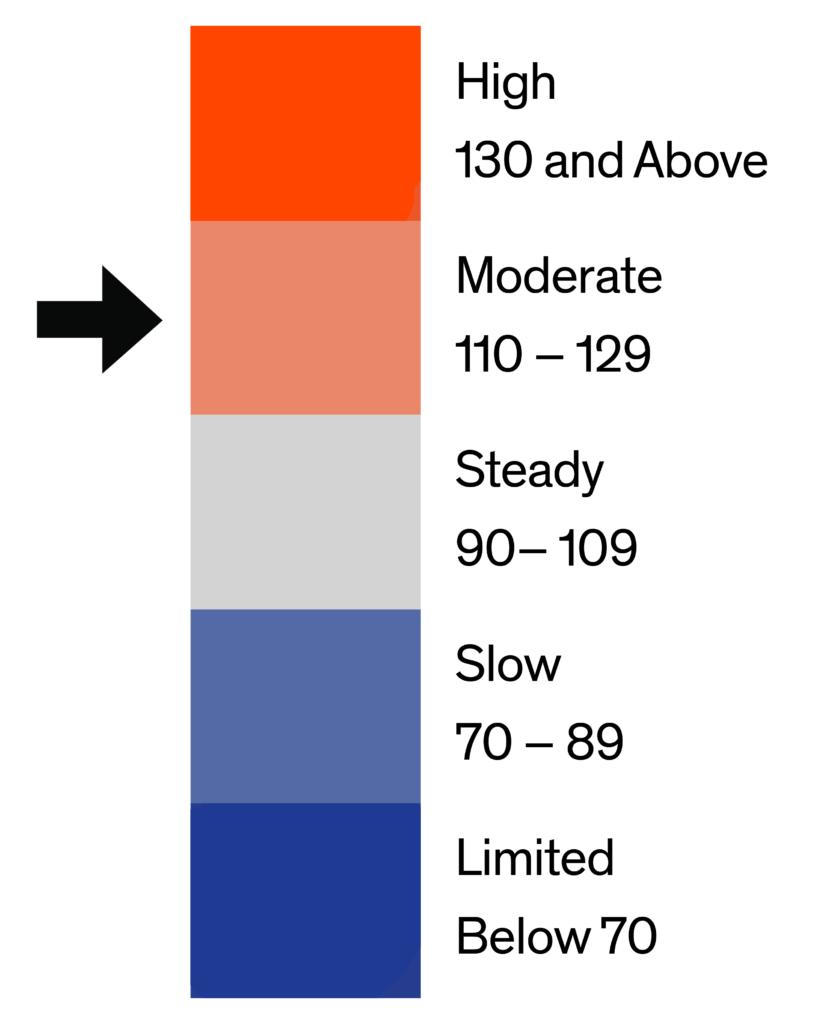
The index for luxury condominium homes in Philadelphia (above $435,000) stands at 110 this report period, up 20 points from last month’s 90 and below the 118 recorded a year ago. That places the tier in Moderate territory, with roughly 6.0 months of inventory across 283 active listings and 47 sales last month. The monthly gain is encouraging, but demand remains below last year’s pace at this price point, so the rebound has not yet closed the annual gap.
Monthly Statistics for Condo Above $435k
Home Demand
Index
110
(Moderate)
Home Demand Index
from prior month
90
Home Demand Index
from prior year
118
Months of
Inventory
6.0
Average daily inventory last month
283
Inventory sold
last month
47
Bright MLS | T3 Home Demand Index

www.homedemandindex.com

This is Tooltip!

Philadelphia | October 2026

Townhouse/Rowhouse/Twin All prices

Townhouse/
Rowhouse/Twin
All prices

The index for townhouses, rowhouses and twins in Philadelphia (all prices) stands at 87 this report period, unchanged from last month’s 87 and below the 91 recorded a year ago. The tier sits in Slow territory with about 4.4 months of inventory across 7,873 active listings and 1,770 sales last month. As the metro’s highest-volume attached format, it typically tracks close to the overall market, and this period it reads 87 against the metro’s 78.
Monthly Statistics for Townhouse/Rowhouse/TwinAll prices
Home Demand
Index
87
(Slow)
Home Demand Index
from prior month
87
Home Demand Index
from prior year
91
Months of
Inventory
4.4
Average daily inventory last month
7,873
Inventory sold
last month
1,770
Bright MLS | T3 Home Demand Index

www.homedemandindex.com

Note

1. This report is generated with data from the following counties:
  • Central Pennsylvania – Adams, PA; Berks, PA; Cumberland, PA; Dauphin, PA; Franklin, PA; Fulton, PA; Lancaster, PA; Lebanon, PA; Perry, PA; Schuylkill, PA; York, PA;
  • Ocean County – Ocean, NJ;
  • Philadelphia Metro – Bucks, PA; Burlington, NJ; Camden, NJ; Chester, PA; Delaware, PA; Gloucester, NJ; Kent, DE; Mercer, NJ; Montgomery, PA; New Castle, DE; Philadelphia, PA;
  • Salem-Cumberland – Cumberland, NJ; Salem, NJ;

2. This report is for the October 2026 period with data collected from the previous month.
Released: October 13, 2026
Reference ID: 2512

Philadelphia | October 2026

Home Demand Map (Zip Codes)

Demand across the Philadelphia metro reflects a broad, multi-state footprint spanning Bucks, Chester, Delaware, Montgomery and Philadelphia counties in Pennsylvania; Burlington, Camden, Gloucester and Mercer counties in New Jersey; and Kent and New Castle counties in Delaware. Buyer activity remains firmest across the Pennsylvania and Delaware submarkets and softest across the New Jersey counties, a spread that has held as the metro-wide index has leveled off. The overall Slow reading of 78 masks that internal variation, with individual counties sitting on either side of the metro average.
Bright MLS | T3 Home Demand Index

www.homedemandindex.com

Embed the Timeline

To embed the map on your website, copy and paste the code below. Please note that the ideal dimensions for displaying the map are 1312 pixels wide by 660 pixels high.

Embed the Map

To embed the map on your website, copy and paste the code below. Please note that the ideal dimensions for displaying the map are 1312 pixels wide by 1182 pixels high.

Embed the Housing Type Bar Chart

To embed the map on your website, copy and paste the code below. Please note that the ideal dimensions for displaying the map are 1312 pixels wide by 880 pixels high.