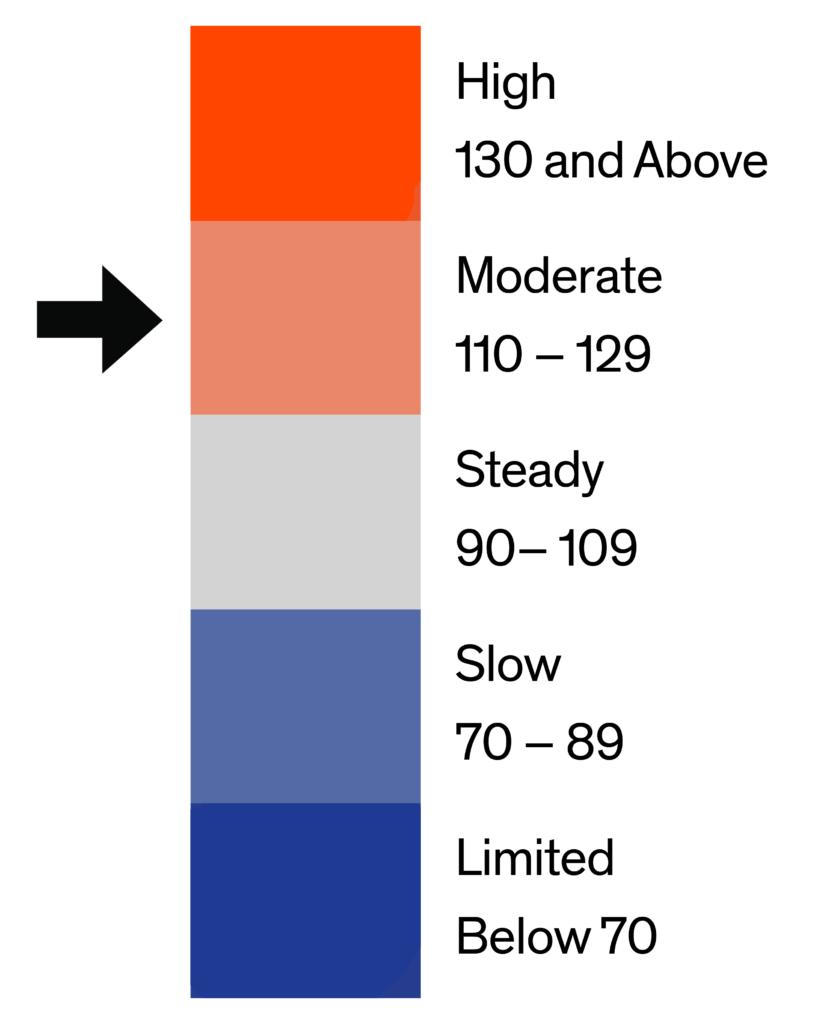
The Bright MLS | T3 Home Demand Index for the Philadelphia MLS market area fell slightly in September to a reading of 129, reflecting a Moderate level of buyer interest. The Index was still 25 percent higher than one year earlier, however, reflecting elevated buyer interest during the past several months. Home demand was solid across most of the region with only a few areas of weak buyer interest.
Among the six types of homes tracked by the Index, demand was in the High or Moderate ranges except for lower-priced single-family homes, which exhibited a Slow pace of buyer interest. Buyer interest was significantly higher than one year earlier in all but the lower-priced single-family segment as well. The months supply of available inventory was lowest in the lower- and mid-priced single-family segments which accounted for nearly half of all sales in September.
Monthly Statistics for October 2020
Home Demand Index
129
(Moderate)
Home Demand Index from prior month
133
Home Demand Index from prior year
103
Index change from prior month
-3%
Index change from same time last year
25.2%
Bright MLS | T3 Home Demand Index
www.homedemandindex.com
Download tile as an image.
Embed this tile on your site.
Philadelphia | October 2020
Home Demand Index | Historical Year-over-Year Comparison
Home demand reached a peak in June, reflecting a delay in the usual peak during the spring buying season. Following an unusually low level of activity that bottomed out in April, demand rose quickly as home buyers re-entered the market, spurred on by low mortgage rates, even amidst uncertainties due to the Covid-19 pandemic. Since rebounding at mid-year, the level of buyer interest has been significantly higher compared with one year earlier.
Home Demand Index
Bright MLS | T3 Home Demand Index
www.homedemandindex.com
Download the top-level Market Areas map as a screenshot.
Embed this tile on your site.
Philadelphia | October 2020
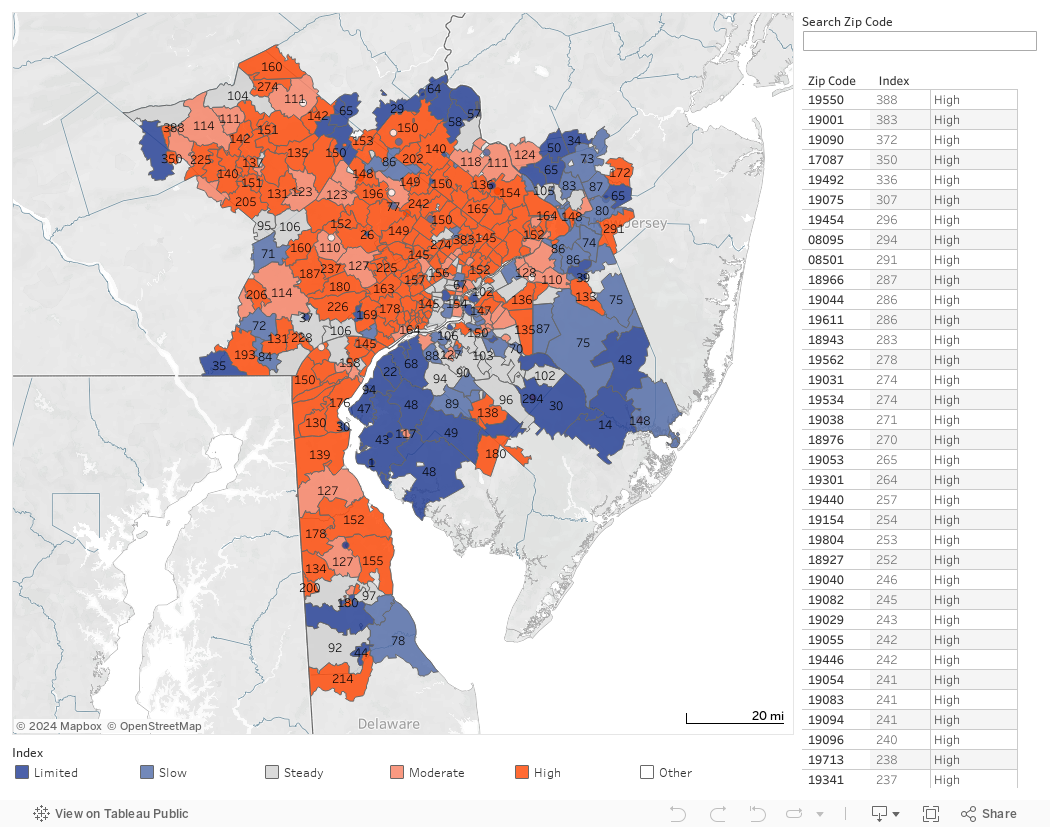
Home Demand Map
The Bright MLS | T3 Home Demand Index recorded elevated buyer demand across most of the Pennsylvania portion of the Philadelphia market area. Demand was High in approximately half of ZIP codes throughout the region. The areas with the softest demand, accounting for about one-quarter of ZIP codes, were mostly in New Jersey and portions of Delaware.
Bright MLS | T3 Home Demand Index
www.homedemandindex.com
Download tile as an image.
Embed this tile on your site.
Philadelphia | October 2020
Demand and Inventory by Home Type
Among the six types of homes tracked by the Index, demand was in the High or Moderate ranges except for lower-priced single-family homes, which exhibited a Slow pace of buyer interest. Buyer interest was significantly higher than one year earlier in all but the lower-priced single-family segment as well. The months supply of available inventory was lowest in the lower- and mid-priced single-family segments which accounted for nearly half of all sales in September.
Bright MLS | T3 Home Demand Index
www.homedemandindex.com
Download tile as an image.
Philadelphia | October 2020
Single Family Home Below $195k
Lower-priced single-family home demand softened in September compared with August, with the Bright MLS | T3 Home Demand Index declining by five percent. Compared to one year earlier the Index was down by 19 percent, suggesting that demand for single-family homes priced below $195,000 has been weakening. Some of the softness can be attributed to low inventory, restraining buyer interest and opportunities to complete the purchase of a home. Also, would-be buyers in this segment have been disproportionately affected by the weak economy, limiting demand even more. With just 1.4 months of supply, buyers had a lean inventory of properties from which to choose.
Monthly Statistics for Single Family Home Below $195k
Home Demand Index
79
(Slow)
Home Demand Index from prior month
83
Home Demand Index from prior year
97
Months of inventory
1.4
Average daily inventory last month
1,074
Inventory sold last month
746
Bright MLS | T3 Home Demand Index
www.homedemandindex.com
Download tile as an image.
Philadelphia | October 2020
Single Family Home $195k - $485k
The Index for mid-priced single-family homes was modestly lower in September compared with August. The Index was 27 percent higher versus a year earlier, placing it in the High market activity category. Inventory was low at just 1.1 months. This segment accounted for more than one-third of sales of all types of homes during the month, but only about one-quarter of the available listings, putting increased pressure on inventory levels.
Monthly Statistics for Single Family Home $195k - $485k
Home Demand Index
132
(High)
Home Demand Index from prior month
137
Home Demand Index from prior year
104
Months of Inventory
1.1
Average daily inventory last month
3,550
Inventory sold last month
3,264
Bright MLS | T3 Home Demand Index
www.homedemandindex.com
Download tile as an image.
Philadelphia | October 2020
Single Family Home Above $485k
Demand for single-family homes priced above $485,000 was stable between August and September, but on a much higher trajectory when compared to a year earlier. The Bright MLS | T3 Home Demand Index recorded a reading of 167, reflecting a High level of buyer interest in this segment. Inventory conditions were only moderately more favorable for buyers compared with other single-family segments at just 2.4 months supply.
Monthly Statistics for Single Family Home Above $485k
Home Demand Index
167
(High)
Home Demand Index from prior month
171
Home Demand Index from prior year
105
Months of Inventory
2.4
Average daily inventory last month
2,561
Inventory sold last month
1,079
Bright MLS | T3 Home Demand Index
www.homedemandindex.com
Download tile as an image.
Philadelphia | October 2020
Condo Below $360k
Demand for lower-priced condo properties softened over the month but was 35 percent higher compared with the year-earlier level. Like most other segments of the Philadelphia market area, the months supply was low at 2.5 months, but still somewhat more favorable for buyers than similarly priced single-family homes.
Monthly Statistics for Condo Below $360k
Home Demand Index
128
(Moderate)
Home Demand Index from prior month
134
Home Demand Index from prior year
95
Months of Inventory
2.5
Average daily inventory last month
968
Inventory sold last month
387
Bright MLS | T3 Home Demand Index
www.homedemandindex.com
This is Tooltip!
Philadelphia | October 2020
Condo Above $360k
Demand for higher-priced condos, the smallest segment of the market, strengthened in September compared with August. The Index, at 155, reflected a three percent increase compared with August. Like lower-priced condos the Index was significantly higher compared with one year earlier, suggesting continued near-term strength across the entire condo market. Inventory was adequate for buyers in this segment with a seven-month supply at the current sales pace.
Monthly Statistics for Condo Above $360k
Home Demand Index
155
(High)
Home Demand Index from prior month
150
Home Demand Index from prior year
110
Months of Inventory
7
Average daily inventory last month
467
Inventory sold last month
67
Bright MLS | T3 Home Demand Index
www.homedemandindex.com
This is Tooltip!
Philadelphia | October 2020
Townhouse/Rowhouse/Twin All prices
Townhouse/ Rowhouse/Twin All prices
The Bright MLS | T3 Home Demand Index for the townhouse segment was down slightly in September but remained elevated. Compared with the year before, the level of buyer interest was 31 percent higher. For some buyers, townhouses are an alternative to similarly priced single-family homes where inventory levels are extremely low, leading to greater demand in this segment. Still, inventory was lean even as buyer interest remained strong resulting in a months supply of 1.8.
Monthly Statistics for Townhouse/Rowhouse/TwinAll prices
Home Demand Index
136
(High)
Home Demand Index from prior month
139
Home Demand Index from prior year
104
Months of Inventory
1.8
Average daily inventory last month
6,059
Inventory sold last month
3,395
Bright MLS | T3 Home Demand Index
www.homedemandindex.com
Note
1. This report is generated with data from the following counties: Berks, PA; Bucks, PA; Burlington, NJ; Camden, NJ; Chester, PA; Delaware, PA; Gloucester, NJ; Kent, DE; Mercer, NJ; Montgomery, PA; New Castle, DE; Philadelphia, PA; Salem, NJ
2. This report is for the October 2020 period with data collected from the previous month.
Released: March 1, 2021
Reference ID: 1071
Philadelphia | October 2020
Home Demand Map (Zip Codes)
The Bright MLS | T3 Home Demand Index recorded elevated buyer demand across most of the Pennsylvania portion of the Philadelphia market area. Demand was High in approximately half of ZIP codes throughout the region. The areas with the softest demand, accounting for about one-quarter of ZIP codes, were mostly in New Jersey and portions of Delaware.
Bright MLS | T3 Home Demand Index
www.homedemandindex.com
Embed the Timeline
To embed the map on your website, copy and paste the code below. Please note that the ideal dimensions for displaying the map are 1312 pixels wide by 660 pixels high.
Embed the Map
To embed the map on your website, copy and paste the code below. Please note that the ideal dimensions for displaying the map are 1312 pixels wide by 1182 pixels high.
Embed the Housing Type Bar Chart
To embed the map on your website, copy and paste the code below. Please note that the ideal dimensions for displaying the map are 1312 pixels wide by 880 pixels high.