Share report on Facebook!
Share on facebook
Share report on Twitter!
Share on twitter
Share report on LinkedIn!
Share on linkedin
Email a link to this Report!
Share on email
Download tile as an image.

Philadelphia | November 2022

Home Demand Index

The Bright MLS | T3 Home Demand Index for the Philadelphia Metro area decreased 10.3 percent in October. The Index, at 87, reflected a Slow pace of demand, down from a Steady pace in September. Compared with one year earlier, the Index was 21.6 percent lower.
Buyer interest in all types of homes decreased over the month. While demand for lower-priced single-family homes was down only slightly, the Index was between 10 percent and 14 percent lower among the remaining segments. Buyer interest was strongest for higher-priced single-family homes, which remained in the High range in October. The months supply rose for each type of home except higher-priced condos. The inventory of homes ranged from a 1.7 months supply for mid-priced single-family homes to a six-month supply for higher-priced condos.
Monthly Statistics for November 2022
Home Demand
Index
87
(Slow)
Home Demand Index
from prior month
97
Home Demand Index
from prior year
111
Index change
from prior month
-10.3%
Index change from
same time last year
-21.6%
Bright MLS | T3 Home Demand Index

www.homedemandindex.com

Download tile as an image.
Embed this tile on your site.

Philadelphia | November 2022

Home Demand Index | Historical Year-over-Year Comparison

Demand for homes has decreased for four consecutive months through October in the Philadelphia Metro area. While a portion of the decline reflects the slower pace of buyer activity in the last few months of the year, higher mortgage rates have also contributed to the slowdown as home shoppers evaluate the increased cost of a mortgage.

Home Demand Index

Bright MLS | T3 Home Demand Index

www.homedemandindex.com

Download the top-level Market Areas map as a screenshot.

Embed this tile on your site.

Philadelphia | November 2022

Home Demand Map

In the Philadelphia Metro area, demand was strongest in New Castle County with an Index in the Moderate range. Demand was Slow in Philadelphia County and Limited in the New Jersey suburbs. Elsewhere in the Philadelphia Metro area buyer interest was Steady. The Index was lower in each Philadelphia Metro area county in October compared with September. Buyer interest remained in the Moderate range in the Salem-Cumberland market area and was at a Slow pace in Central Pennsylvania. Across the Greater Philadelphia Metro area, demand was High in 16 percent of ZIP codes in October compared with 22 percent in September. In 37 percent of ZIP codes demand was in the Limited range versus 29 percent in September.
Bright MLS | T3 Home Demand Index

www.homedemandindex.com

Download tile as an image.
Embed this tile on your site.

Philadelphia | November 2022

Demand and Inventory by Home Type

Buyer interest in all types of homes decreased over the month. While demand for lower-priced single-family homes was down only slightly, the Index was between 10 percent and 14 percent lower among the remaining segments. Buyer interest was strongest for higher-priced single-family homes, which remained in the High range in October. The months supply rose for each type of home except higher-priced condos. The inventory of homes ranged from a 1.7 months supply for mid-priced single-family homes to a six-month supply for higher-priced condos.
Bright MLS | T3 Home Demand Index

www.homedemandindex.com

Download tile as an image.

Philadelphia | November 2022

Single Family Home Below $195k

Demand for lower-priced single-family homes was virtually unchanged in October. The Index, at 22, reflected Limited buyer interest. The months supply of homes rose to 2.4 months from 1.9 months in September largely due to a lower level of sales over the month and a marginal increase in the number of listings.
Monthly Statistics for Single Family Home Below $195k
Home Demand
Index
22
(Limited)
Home Demand Index
from prior month
23
Home Demand Index
from prior year
38
Months of
inventory
2.4
Average daily inventory last month
345
Inventory sold
last month
141
Bright MLS | T3 Home Demand Index

www.homedemandindex.com

Download tile as an image.

Philadelphia | November 2022

Single Family Home $195k - $485k

Buyer interest in mid-priced single-family homes eased in October. The Index, down 11 percent over the month and 28 percent lower than one year earlier, reflected a Slow pace of demand. The months supply rose to 1.7 months but remained lower than any other type of home in the Philadelphia Metro area.
Monthly Statistics for Single Family Home $195k - $485k
Home Demand
Index
84
(Slow)
Home Demand Index
from prior month
94
Home Demand Index
from prior year
117
Months of
Inventory
1.7
Average daily inventory last month
2,903
Inventory sold
last month
1,700
Bright MLS | T3 Home Demand Index

www.homedemandindex.com

Download tile as an image.

Philadelphia | November 2022

Single Family Home Above $485k

The Bright MLS | T3 Home Demand Index for higher-priced single-family homes fell over the month but at 156, continued to reflect a High level of demand. Notably, the Index was only seven percent lower than one year earlier, a far smaller decline than any other segment of the metro area market. The inventory of homes for sale rose to 2.4 months from a two-month supply in September due mostly to a decrease in sales and largely unchanged number of listings on the market.
Monthly Statistics for Single Family Home Above $485k
Home Demand
Index
156
(High)
Home Demand Index
from prior month
175
Home Demand Index
from prior year
167
Months of
Inventory
2.4
Average daily inventory last month
2,094
Inventory sold
last month
885
Bright MLS | T3 Home Demand Index

www.homedemandindex.com

Download tile as an image.

Philadelphia | November 2022

Condo Below $360k

Demand for lower-priced condos was Slow in October with the Bright MLS | T3 Home Demand Index decreasing by 10 percent to 87. Buyer interest was Steady in September. The months supply rose marginally to 2.2 months.
Monthly Statistics for Condo Below $360k
Home Demand
Index
87
(Slow)
Home Demand Index
from prior month
97
Home Demand Index
from prior year
117
Months of
Inventory
2.2
Average daily inventory last month
622
Inventory sold
last month
279
Bright MLS | T3 Home Demand Index

www.homedemandindex.com

This is Tooltip!

Philadelphia | November 2022

Condo Above $360k

Buyer interest in higher-priced condos was Moderate October with the Index at 113, a 14 percent decline from September. The months supply decreased to six months from 6.4 months, a more than adequate level of inventory despite the drop.
Monthly Statistics for Condo Above $360k
Home Demand
Index
113
(Moderate)
Home Demand Index
from prior month
131
Home Demand Index
from prior year
134
Months of
Inventory
6
Average daily inventory last month
349
Inventory sold
last month
58
Bright MLS | T3 Home Demand Index

www.homedemandindex.com

This is Tooltip!

Philadelphia | November 2022

Townhouse/Rowhouse/Twin All prices

Townhouse/
Rowhouse/Twin
All prices

The Bright MLS | T3 Home Demand Index for townhouses was down 10 percent to 94 in October, a reading consistent with a Steady pace of demand. The months supply rose to 3.2 months from 2.8 months in September reflecting a combination of lower sales and a marginally higher number of listings.
Monthly Statistics for Townhouse/Rowhouse/TwinAll prices
Home Demand
Index
94
(Steady)
Home Demand Index
from prior month
105
Home Demand Index
from prior year
120
Months of
Inventory
3.2
Average daily inventory last month
6,337
Inventory sold
last month
1,962
Bright MLS | T3 Home Demand Index

www.homedemandindex.com

Note

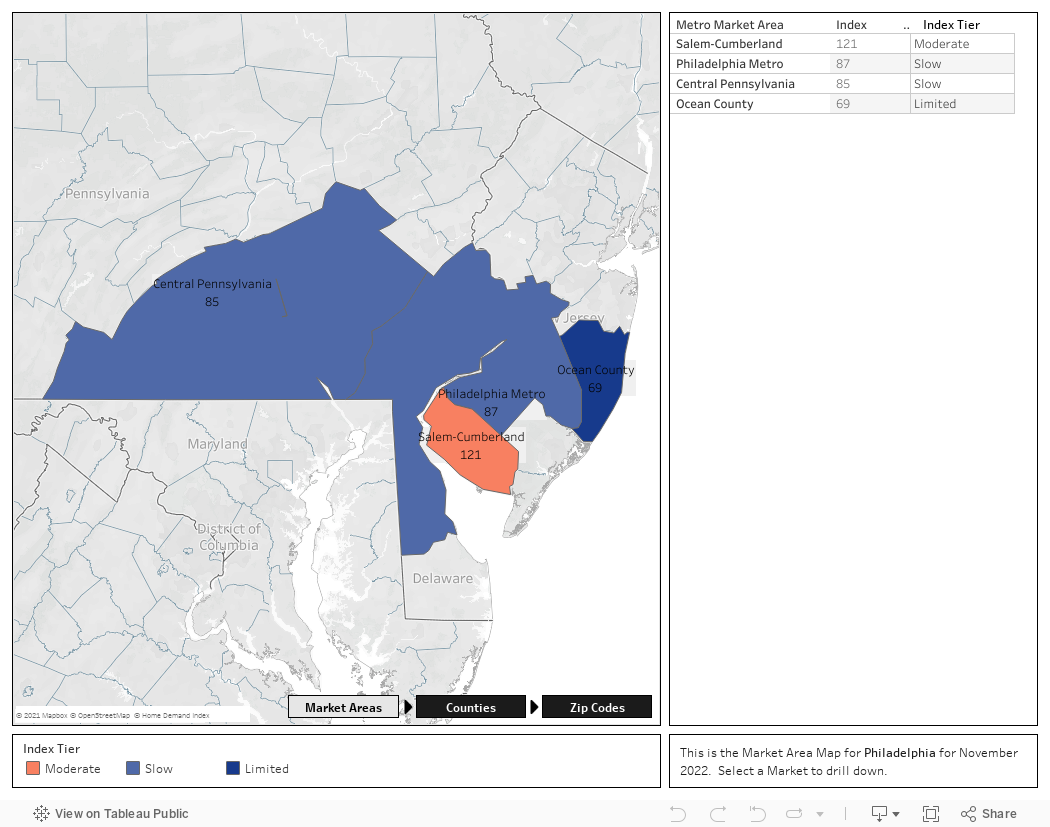
1. This report is generated with data from the following counties:
  • Central Pennsylvania – Adams, PA; Berks, PA; Cumberland, PA; Dauphin, PA; Franklin, PA; Fulton, PA; Lancaster, PA; Lebanon, PA; Perry, PA; Schuylkill, PA; York, PA;
  • Ocean County – Ocean, NJ;
  • Philadelphia Metro – Bucks, PA; Burlington, NJ; Camden, NJ; Chester, PA; Delaware, PA; Gloucester, NJ; Kent, DE; Mercer, NJ; Montgomery, PA; New Castle, DE; Philadelphia, PA;
  • Salem-Cumberland – Cumberland, NJ; Salem, NJ;
2. This report is for the November 2022 period with data collected from the previous month.
Released: November 11, 2022
Reference ID: 1712

Philadelphia | November 2022

Home Demand Map (Zip Codes)

In the Philadelphia Metro area, demand was strongest in New Castle County with an Index in the Moderate range. Demand was Slow in Philadelphia County and Limited in the New Jersey suburbs. Elsewhere in the Philadelphia Metro area buyer interest was Steady. The Index was lower in each Philadelphia Metro area county in October compared with September. Buyer interest remained in the Moderate range in the Salem-Cumberland market area and was at a Slow pace in Central Pennsylvania. Across the Greater Philadelphia Metro area, demand was High in 16 percent of ZIP codes in October compared with 22 percent in September. In 37 percent of ZIP codes demand was in the Limited range versus 29 percent in September.
Bright MLS | T3 Home Demand Index

www.homedemandindex.com

Embed the Timeline

To embed the map on your website, copy and paste the code below. Please note that the ideal dimensions for displaying the map are 1312 pixels wide by 660 pixels high.

Embed the Map

To embed the map on your website, copy and paste the code below. Please note that the ideal dimensions for displaying the map are 1312 pixels wide by 1182 pixels high.

Embed the Housing Type Bar Chart

To embed the map on your website, copy and paste the code below. Please note that the ideal dimensions for displaying the map are 1312 pixels wide by 880 pixels high.