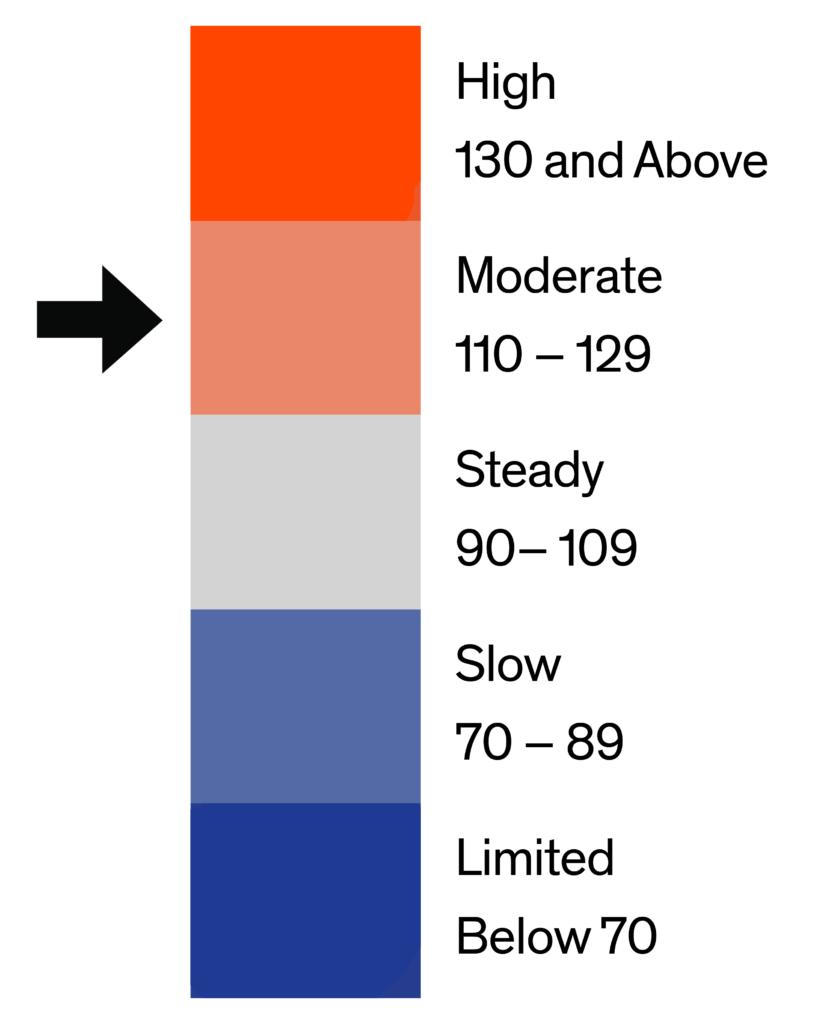
The Bright MLS | T3 Home Demand Index was down slightly in October to a reading of 126, placing the demand for homes in the Philadelphia MLS market area in the Moderate category. The Index was 27 percent higher compared with the previous year even as home prices continued to rise and the inventory of homes for sale remained lean.
According to the Bright MLS | T3 Home Demand Index, buyer interest in October was strong among most segments in the Philadelphia market area. Demand for single-family homes priced below $195,000 was Slow, however, and was well below the pace of one year earlier. Except for the higher-priced condo segment, all types of homes posted lean inventory levels. Buyers looking for single-family homes below $485,000 were confronted with especially tight inventory conditions.
Monthly Statistics for November 2020
Home Demand Index
126
(Moderate)
Home Demand Index from prior month
129
Home Demand Index from prior year
99
Index change from prior month
-2.3%
Index change from same time last year
27.3%
Bright MLS | T3 Home Demand Index
www.homedemandindex.com
Download tile as an image.
Embed this tile on your site.
Philadelphia | November 2020
Home Demand Index | Historical Year-over-Year Comparison
The Index has been at an elevated level compared with the previous year since June when home buyers returned to the market following the on-set of local restrictions and uncertainties connected with the Covid-19 pandemic. Low mortgage rates added a level of urgency, along with a delay in the usual spring buying season, which resulted in strong buyer interest and lean inventories of homes for sale.
Home Demand Index
Bright MLS | T3 Home Demand Index
www.homedemandindex.com
Download the top-level Market Areas map as a screenshot.
Embed this tile on your site.
Philadelphia | November 2020
Home Demand Map
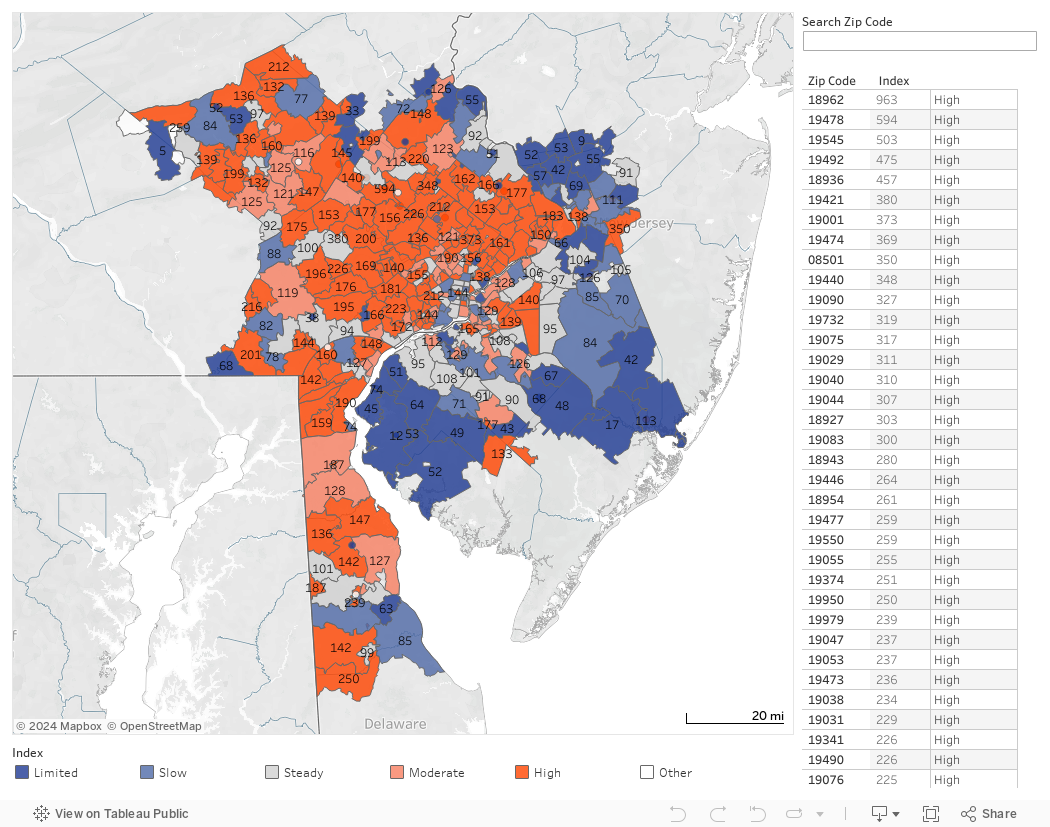
Forty-three percent of ZIP codes in the Philadelphia market area recorded a Bright MLS | T3 Home Demand Index in the High category. An additional 14 percent were in the Moderate category. Few of the High demand areas were in the New Jersey portion of the market area where buyer interest was concentrated in the Steady or Slow category.
Bright MLS | T3 Home Demand Index
www.homedemandindex.com
Download tile as an image.
Embed this tile on your site.
Philadelphia | November 2020
Demand and Inventory by Home Type
According to the Bright MLS | T3 Home Demand Index, buyer interest in October was strong among most segments in the Philadelphia market area. Demand for single-family homes priced below $195,000 was Slow, however, and was well below the pace of one year earlier. Except for the higher-priced condo segment, all types of homes posted lean inventory levels. Buyers looking for single-family homes below $485,000 were confronted with especially tight inventory conditions.
Bright MLS | T3 Home Demand Index
www.homedemandindex.com
Download tile as an image.
Philadelphia | November 2020
Single Family Home Below $195k
The Index for single-family homes priced below $195,000 fell in October compared with September. Additionally, the level of buyer interest was down significantly compared with one year earlier. The decline in the Index likely reflected softer demand as would-be buyers in this segment confront stresses in their financial situation stemming from the recession and pandemic as well as limited inventory that lengthens the search required to find a suitable home. Lower-priced single-family inventory conditions remained very tight at just 1.3 months supply. With fewer than seven percent of listings among all property types, would-be buyers were limited in their search and may instead have opted for similarly priced townhouse or condo properties where inventory conditions were somewhat more favorable.
Monthly Statistics for Single Family Home Below $195k
Home Demand Index
74
(Slow)
Home Demand Index from prior month
79
Home Demand Index from prior year
98
Months of inventory
1.3
Average daily inventory last month
1,006
Inventory sold last month
801
Bright MLS | T3 Home Demand Index
www.homedemandindex.com
Download tile as an image.
Philadelphia | November 2020
Single Family Home $195k - $485k
Mid-priced single-family homes, accounting for more than one-third of sales in October, attracted strong buyer interest, with an Index reading of 133. The latest data reflect an increase of less than one percent during the month, and a 37 percent increase compared with one year earlier. Among all types of homes, inventory conditions in the mid-priced single-family segment were the tightest, with a months supply of just 1.1. The latest data is consistent with readings from previous months where buyer interest and sales remained elevated.
Monthly Statistics for Single Family Home $195k - $485k
Home Demand Index
133
(High)
Home Demand Index from prior month
132
Home Demand Index from prior year
97
Months of Inventory
1.1
Average daily inventory last month
3,514
Inventory sold last month
3,337
Bright MLS | T3 Home Demand Index
www.homedemandindex.com
Download tile as an image.
Philadelphia | November 2020
Single Family Home Above $485k
The Bright MLS | T3 Home Demand Index for single-family homes priced above $485,000 was down slightly in October compared with the previous month. Accounting for 11 percent of sales over the month, the strength of this segment is supported by attractive mortgage interest rates and pent-up demand. Inventory conditions remained tight although more favorable for buyers than other segments of the single-family market. Still, buyers faced a challenging environment with a months supply of just 2.3 in October.
Monthly Statistics for Single Family Home Above $485k
Home Demand Index
164
(High)
Home Demand Index from prior month
167
Home Demand Index from prior year
95
Months of Inventory
2.3
Average daily inventory last month
2,449
Inventory sold last month
1,043
Bright MLS | T3 Home Demand Index
www.homedemandindex.com
Download tile as an image.
Philadelphia | November 2020
Condo Below $360k
The lower-priced condo segment in the Philadelphia market area remained on a solid footing with an Index reading of 126, reflecting a Moderate level of buyer demand in October. While only slightly lower than the previous month, the level of buyer interest was 31 percent higher than a year earlier. The months supply of lower-priced condo properties was 2.3, making this segment an alternative for some buyers unable to purchase similarly priced single-family homes where inventories are more limited.
Monthly Statistics for Condo Below $360k
Home Demand Index
126
(Moderate)
Home Demand Index from prior month
128
Home Demand Index from prior year
96
Months of Inventory
2.3
Average daily inventory last month
1,016
Inventory sold last month
437
Bright MLS | T3 Home Demand Index
www.homedemandindex.com
This is Tooltip!
Philadelphia | November 2020
Condo Above $360k
The higher-priced condo segment, accounting for less than one percent of sales in October, is also the most volatile. While the Index was 27 percent higher than one year ago, it declined by 21 percent compared with the previous month. Even so, buyer interest in this segment remained in the Moderate category. With a 7.7 months supply, buyers searching for a condo priced above $360,000 found adequate inventory.
Monthly Statistics for Condo Above $360k
Home Demand Index
123
(Moderate)
Home Demand Index from prior month
155
Home Demand Index from prior year
97
Months of Inventory
7.7
Average daily inventory last month
468
Inventory sold last month
61
Bright MLS | T3 Home Demand Index
www.homedemandindex.com
This is Tooltip!
Philadelphia | November 2020
Townhouse/Rowhouse/Twin All prices
Townhouse/ Rowhouse/Twin All prices
The townhouse segment has been among the types of homes with the highest level of buyer interest for the past few months. In October, the Index reached a reading of 131, an increase of 26 percent compared with one year earlier. In addition to favorable mortgage interest rates, this segment offers, along with condos, options for many first-time buyers challenged by tight inventory conditions in other segments of the market. The months supply, at 1.8, was still very low although offering more opportunities for buyers than the lower- and mid-priced single-family segments.
Monthly Statistics for Townhouse/Rowhouse/TwinAll prices
Home Demand Index
131
(High)
Home Demand Index from prior month
136
Home Demand Index from prior year
104
Months of Inventory
1.8
Average daily inventory last month
6,070
Inventory sold last month
3,400
Bright MLS | T3 Home Demand Index
www.homedemandindex.com
Note
1. This report is generated with data from the following counties: Berks, PA; Bucks, PA; Burlington, NJ; Camden, NJ; Chester, PA; Delaware, PA; Gloucester, NJ; Kent, DE; Mercer, NJ; Montgomery, PA; New Castle, DE; Philadelphia, PA; Salem, NJ
2. This report is for the November 2020 period with data collected from the previous month.
Released: March 2, 2021
Reference ID: 1068
Philadelphia | November 2020
Home Demand Map (Zip Codes)
Forty-three percent of ZIP codes in the Philadelphia market area recorded a Bright MLS | T3 Home Demand Index in the High category. An additional 14 percent were in the Moderate category. Few of the High demand areas were in the New Jersey portion of the market area where buyer interest was concentrated in the Steady or Slow category.
Bright MLS | T3 Home Demand Index
www.homedemandindex.com
Embed the Timeline
To embed the map on your website, copy and paste the code below. Please note that the ideal dimensions for displaying the map are 1312 pixels wide by 660 pixels high.
Embed the Map
To embed the map on your website, copy and paste the code below. Please note that the ideal dimensions for displaying the map are 1312 pixels wide by 1182 pixels high.
Embed the Housing Type Bar Chart
To embed the map on your website, copy and paste the code below. Please note that the ideal dimensions for displaying the map are 1312 pixels wide by 880 pixels high.