Demand for homes in the Philadelphia MLS market area rose 10 percent in April based on the latest Bright MLS | T3 Home Demand Index. The Index recorded a reading of 143, reflecting a High level of demand for homes. Compared to one year earlier, the Index was 151 percent higher, a striking difference due largely to the significant drop in home search activity in early 2020 at the beginning of the pandemic.
Among the types of homes tracked by the Bright MLS | T3 Home Demand Index, buyer interest continued to rise in most segments, even if only at a moderate pace. Demand was in the High category among all home types except lower-price single-family, which continued a months-long trend of subdued demand. There was little relief for would-be buyers searching for a home. The month’s supply ranged from just 1.1 for mid-priced single-family homes, representing about one-third of sales, to 5.1 months in the much smaller higher-priced condo segment.
Monthly Statistics for May 2021
Home Demand Index
143
(High)
Home Demand Index from prior month
130
Home Demand Index from prior year
57
Index change from prior month
10%
Index change from same time last year
150.9%
Bright MLS | T3 Home Demand Index
www.homedemandindex.com
Download tile as an image.
Embed this tile on your site.
Philadelphia | May 2021
Home Demand Index | Historical Year-over-Year Comparison
Buyer interest in Philadelphia area homes rose for the second consecutive month following a pause in demand in February. Overall, demand has risen at a rapid pace since the seasonal low in December. In fact, the Bright MLS | T3 Home Demand Index has been higher than the year-earlier level in 10 of the past 12 months.
Home Demand Index
Bright MLS | T3 Home Demand Index
www.homedemandindex.com
Download the top-level Market Areas map as a screenshot.
Embed this tile on your site.
Philadelphia | May 2021
Home Demand Map
Nearly half of ZIP codes across the Philadelphia market area recorded an Index reading in the High category in April, a slightly higher percentage compared with March. Demand in an additional one-third of ZIP codes was Moderate or Steady. Areas of weaker demand were concentrated in the New Jersey portion of the market area and in a handful of outer suburban communities.
Bright MLS | T3 Home Demand Index
www.homedemandindex.com
Download tile as an image.
Embed this tile on your site.
Philadelphia | May 2021
Demand and Inventory by Home Type
Among the types of homes tracked by the Bright MLS | T3 Home Demand Index, buyer interest continued to rise in most segments, even if only at a moderate pace. Demand was in the High category among all home types except lower-price single-family, which continued a months-long trend of subdued demand. There was little relief for would-be buyers searching for a home. The month’s supply ranged from just 1.1 for mid-priced single-family homes, representing about one-third of sales, to 5.1 months in the much smaller higher-priced condo segment.
Bright MLS | T3 Home Demand Index
www.homedemandindex.com
Download tile as an image.
Philadelphia | May 2021
Single Family Home Below $195k
Demand for lower-priced single-family family homes was unchanged in April compared with the previous month. The Index was at a reading of 60, which is consistent with Limited buyer interest. Home demand in this segment has been weak for several months, even as other segments of the market have shown greater resilience. Despite the weak demand, the inventory of homes has remained lean, consistent with conditions in other segments of the Philadelphia market. In April, the month’s supply was 1.4, unchanged from the previous month.
Monthly Statistics for Single Family Home Below $195k
Home Demand Index
60
(Limited)
Home Demand Index from prior month
60
Home Demand Index from prior year
63
Months of inventory
1.4
Average daily inventory last month
645
Inventory sold last month
473
Bright MLS | T3 Home Demand Index
www.homedemandindex.com
Download tile as an image.
Philadelphia | May 2021
Single Family Home $195k - $485k
Buyer interest in single-family homes priced between $195,000 and $485,000, accounting for about one-third of sales among all types of homes, rose by 14 percent in April. The Index posted a reading of 150, consistent with a High level of demand. There was a 1.1 months supply of homes available for sale, nearly unchanged from the previous month.
Monthly Statistics for Single Family Home $195k - $485k
Home Demand Index
150
(High)
Home Demand Index from prior month
132
Home Demand Index from prior year
60
Months of Inventory
1.1
Average daily inventory last month
2,492
Inventory sold last month
2,354
Bright MLS | T3 Home Demand Index
www.homedemandindex.com
Download tile as an image.
Philadelphia | May 2021
Single Family Home Above $485k
Demand for higher-priced single-family homes rose a solid 15 percent in April, continuing a pattern of High demand that emerged in early 2021. Despite the elevated price point, demand has been higher than other lower-priced segments of the single-family market for several months. The month’s supply of homes for sale, at 2.1 in April, was higher than other single-family segments.
Monthly Statistics for Single Family Home Above $485k
Home Demand Index
226
(High)
Home Demand Index from prior month
197
Home Demand Index from prior year
53
Months of Inventory
2.1
Average daily inventory last month
1,781
Inventory sold last month
849
Bright MLS | T3 Home Demand Index
www.homedemandindex.com
Download tile as an image.
Philadelphia | May 2021
Condo Below $360k
The Bright MLS | T3 Home Demand Index for lower-priced condos, which accounted for six percent of sales in April, rose marginally to 148 and remained in the High category. Like other segments of the Philadelphia market, buyers found their search for condos challenging, although the month’s supply was higher than similarly priced single-family segments. The month’s supply was 2.2 in April, unchanged from the previous month.
Monthly Statistics for Condo Below $360k
Home Demand Index
148
(High)
Home Demand Index from prior month
141
Home Demand Index from prior year
53
Months of Inventory
2.2
Average daily inventory last month
871
Inventory sold last month
402
Bright MLS | T3 Home Demand Index
www.homedemandindex.com
This is Tooltip!
Philadelphia | May 2021
Condo Above $360k
The Index for condos priced above $360,000 rose in April to a value of 202, a reading second only to single-family homes priced above $485,000. Even with a High level of demand, there was an adequate inventory with a month’s supply of 5.1, unchanged from March.
Monthly Statistics for Condo Above $360k
Home Demand Index
202
(High)
Home Demand Index from prior month
192
Home Demand Index from prior year
40
Months of Inventory
5.1
Average daily inventory last month
428
Inventory sold last month
84
Bright MLS | T3 Home Demand Index
www.homedemandindex.com
This is Tooltip!
Philadelphia | May 2021
Townhouse/Rowhouse/Twin All prices
Townhouse/ Rowhouse/Twin All prices
Buyer interest in townhouses rose somewhat in April to an Index reading of 149, well above the threshold signifying a High level of demand. Townhouses accounted for slightly more than 40 percent of listings and sales in April, ultimately driving a large portion of activity in the Philadelphia market. In April, the month’s supply was low at 1.7, but up marginally from the March level.
Monthly Statistics for Townhouse/Rowhouse/TwinAll prices
Home Demand Index
149
(High)
Home Demand Index from prior month
140
Home Demand Index from prior year
54
Months of Inventory
1.7
Average daily inventory last month
4,733
Inventory sold last month
2,851
Bright MLS | T3 Home Demand Index
www.homedemandindex.com
Note
1. This report is generated with data from the following counties: Berks, PA; Bucks, PA; Burlington, NJ; Camden, NJ; Chester, PA; Delaware, PA; Gloucester, NJ; Kent, DE; Mercer, NJ; Montgomery, PA; New Castle, DE; Philadelphia, PA; Salem, NJ
2. This report is for the May 2021 period with data collected from the previous month.
Released: May 11, 2021
Reference ID: 1176
Philadelphia | May 2021
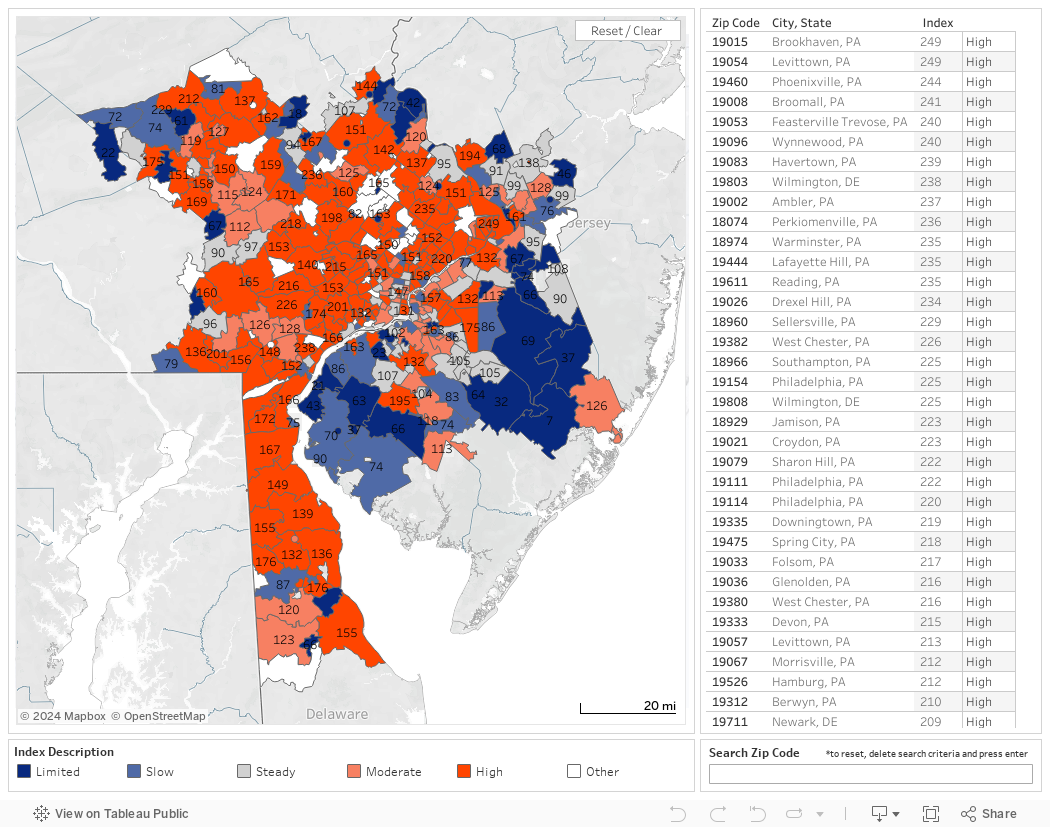
Home Demand Map (Zip Codes)
Nearly half of ZIP codes across the Philadelphia market area recorded an Index reading in the High category in April, a slightly higher percentage compared with March. Demand in an additional one-third of ZIP codes was Moderate or Steady. Areas of weaker demand were concentrated in the New Jersey portion of the market area and in a handful of outer suburban communities.
Bright MLS | T3 Home Demand Index
www.homedemandindex.com
Embed the Timeline
To embed the map on your website, copy and paste the code below. Please note that the ideal dimensions for displaying the map are 1312 pixels wide by 660 pixels high.
Embed the Map
To embed the map on your website, copy and paste the code below. Please note that the ideal dimensions for displaying the map are 1312 pixels wide by 1182 pixels high.
Embed the Housing Type Bar Chart
To embed the map on your website, copy and paste the code below. Please note that the ideal dimensions for displaying the map are 1312 pixels wide by 880 pixels high.