March 2023 Report
Philadelphia Metro
Philadelphia | March 2023
Home Demand Index
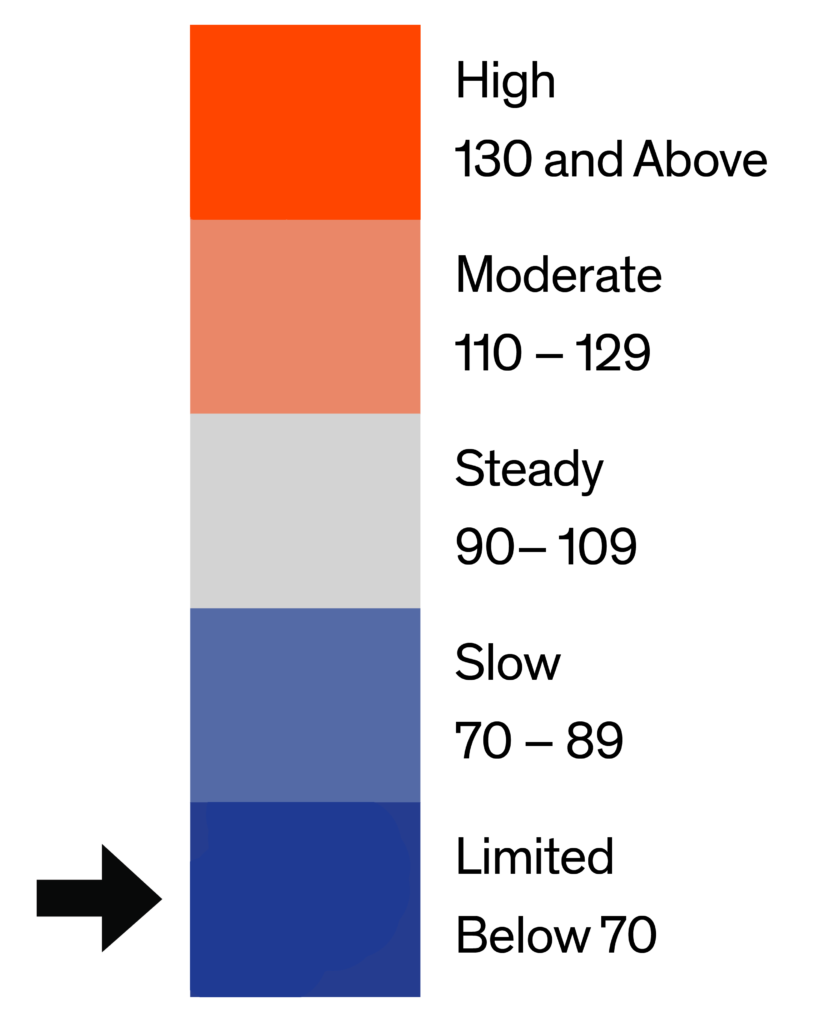
The Bright MLS | T3 Home Demand Index for the Philadelphia Metro are rose modestly in February. The Index increased 4.1 percent to 77, which was consistent with a Slow pace of buyer activity but was 26 percent lower than one year earlier.
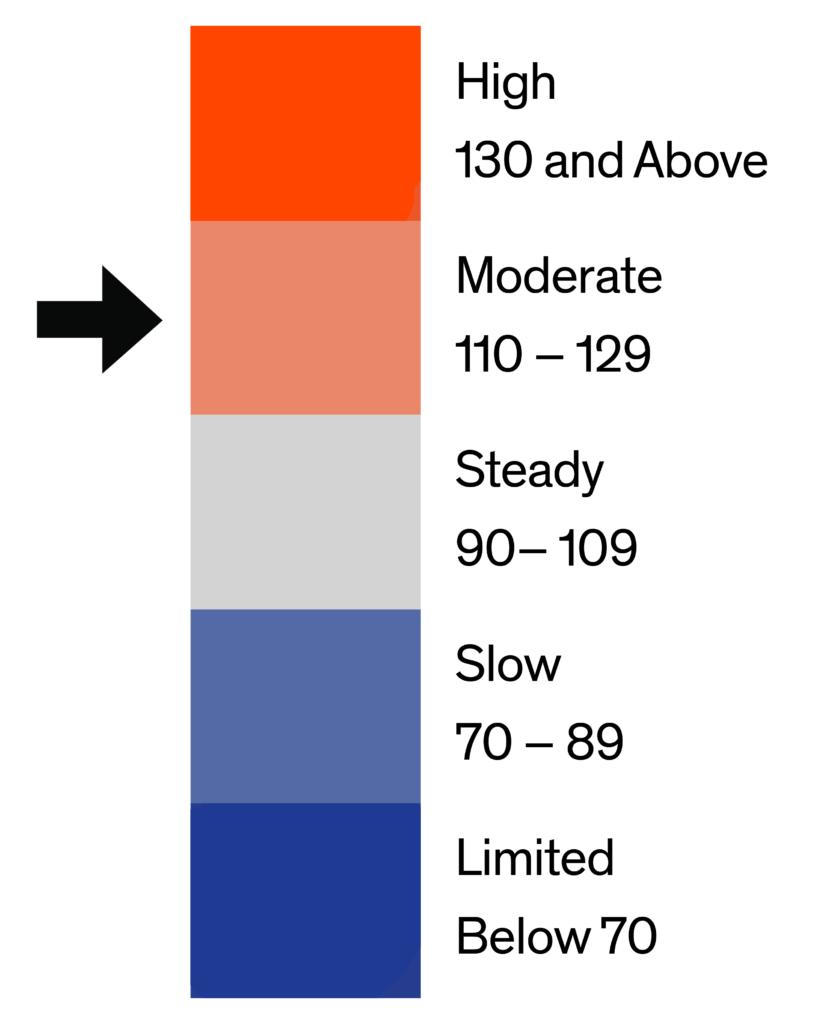
The Index for luxury single-family homes rose 18 percent in February while demand among the remaining segments changed little over the month. Demand for luxury condos was higher than any other segment with activity in the Moderate category. Buyer interest in mid-market and luxury single-family homes was Limited while demand was Slow for the remaining types of homes. The months supply ranged from a low of two months for mid-market single-family homes to a high of 7.1 months for luxury condos. The months supply of luxury single-family homes and condos rose over the month and was unchanged for the other segments.

Monthly Statistics for March 2023
Home Demand
Index
Index
77
(Slow)
Home Demand Index
from prior month
from prior month
74
Home Demand Index
from prior year
from prior year
104
Index change
from prior month
from prior month
4.1%
Index change from
same time last year
same time last year
-26%
Bright MLS | T3 Home Demand Index
www.homedemandindex.com
Philadelphia | March 2023
Home Demand Index | Historical Year-over-Year Comparison
Demand for homes in the Philadelphia Metro area was up for the second consecutive month although at a slower pace than in January. The modest rise in the Index was likely the result of a jump in mortgage rates in February and ongoing uncertainty about overall economic conditions that may have cause some buyers to re-evaluate the intensity of their home search. The rise in buyer activity in February was much slower than last year.
Home Demand Index
Bright MLS | T3 Home Demand Index
www.homedemandindex.com
Philadelphia | March 2023
Home Demand Map
Demand for homes was Steady in Kent County and Slow across the other metro counties in Pennsylvania and Delaware. The Index for each of the New Jersey counties in the metro area was in the Limited category. Buyer activity was Steady in the Salem-Cumberland market area and at a Slow pace in Central Pennsylvania. Across the Greater Philadelphia area, buyer activity in 68 percent of ZIP codes was in the Slow or Limited range, a somewhat lower percentage than in January. In contrast, demand in just 10 percent of ZIP codes was in the High category.
Bright MLS | T3 Home Demand Index
www.homedemandindex.com
Philadelphia | March 2023
Demand and Inventory by Home Type
The Index for luxury single-family homes rose 18 percent in February while demand among the remaining segments changed little over the month. Demand for luxury condos was higher than any other segment with activity in the Moderate category. Buyer interest in mid-market and luxury single-family homes was Limited while demand was Slow for the remaining types of homes. The months supply ranged from a low of two months for mid-market single-family homes to a high of 7.1 months for luxury condos. The months supply of luxury single-family homes and condos rose over the month and was unchanged for the other segments.
Bright MLS | T3 Home Demand Index
www.homedemandindex.com
Philadelphia | March 2023
Single Family Home Below $300k
Buyer interest in entry-level single-family homes changed little in February and remained at a Slow pace. The Index, at 78, was 26 percent below the level one year earlier when demand was in the Steady category. The supply of homes remained low with 2.1 months of inventory available for sale, unchanged from January.

Monthly Statistics for Single Family Home Below $300k
Home Demand
Index
Index
78
(Slow)
Home Demand Index
from prior month
from prior month
77
Home Demand Index
from prior year
from prior year
105
Months of
inventory
inventory
2.1
Average daily inventory last month
890
Inventory sold
last month
last month
429
Bright MLS | T3 Home Demand Index
www.homedemandindex.com
Philadelphia | March 2023
Single Family Home $300k - $680k
Demand for mid-market single-family homes, which account for roughly one-third of metro area sales, remained in the Limited category. The Index, at 67, was down marginally over the month and 30 percent below the level one year earlier. There was a two-month supply of homes for sale, unchanged from January.

Monthly Statistics for Single Family Home $300k - $680k
Home Demand
Index
Index
67
(Limited)
Home Demand Index
from prior month
from prior month
69
Home Demand Index
from prior year
from prior year
94
Months of
Inventory
Inventory
2
Average daily inventory last month
1,979
Inventory sold
last month
last month
989
Bright MLS | T3 Home Demand Index
www.homedemandindex.com
Philadelphia | March 2023
Single Family Home Above $680k
Although the Index for luxury single-family homes rose in February it remained in the Limited demand category. The Index, at 60 was roughly one-third lower than a year earlier when demand was in the Slow range. The months supply rose to 3.9 months from 3.1 months in January as both the number of listings and sales decreased over the month.

Monthly Statistics for Single Family Home Above $680k
Home Demand
Index
Index
60
(Limited)
Home Demand Index
from prior month
from prior month
51
Home Demand Index
from prior year
from prior year
87
Months of
Inventory
Inventory
3.9
Average daily inventory last month
729
Inventory sold
last month
last month
185
Bright MLS | T3 Home Demand Index
www.homedemandindex.com
Philadelphia | March 2023
Condo Below $390k
The Bright MLS | T3 Home Demand Index for entry-level condos was virtually unchanged in February at 82, reflecting a Slow pace of buyer activity. By comparison, demand was in the Moderate range one year earlier. The months supply rose to 3.1 from 2.6 months in February.

Monthly Statistics for Condo Below $390k
Home Demand
Index
Index
82
(Slow)
Home Demand Index
from prior month
from prior month
83
Home Demand Index
from prior year
from prior year
112
Months of
Inventory
Inventory
3.1
Average daily inventory last month
581
Inventory sold
last month
last month
188
Bright MLS | T3 Home Demand Index
www.homedemandindex.com
Philadelphia | March 2023
Condo Above $390k
Buyer interest in luxury condos was in the Moderate category, higher than any other segment of the Philadelphia Metro market. The Index rose marginally over the month but was still well below the High level of demand one year earlier. There was a 7.1 months supply of homes on the market, an uptick from the 6.8 months supply in January.

Monthly Statistics for Condo Above $390k
Home Demand
Index
Index
116
(Moderate)
Home Demand Index
from prior month
from prior month
113
Home Demand Index
from prior year
from prior year
165
Months of
Inventory
Inventory
7.1
Average daily inventory last month
263
Inventory sold
last month
last month
37
Bright MLS | T3 Home Demand Index
www.homedemandindex.com
Philadelphia | March 2023
Townhouse/Rowhouse/Twin All prices
Townhouse/
Rowhouse/Twin
All prices
Demand for townhouses rose marginally in February. The Bright MLS | T3 Home Demand Index, at 89, continued to reflect a Slow pace of buyer activity. The months supply, at 3.7, was unchanged from January as both sales and the number of listings were virtually unchanged over the month.

Monthly Statistics for Townhouse/Rowhouse/TwinAll prices
Home Demand
Index
Index
89
(Slow)
Home Demand Index
from prior month
from prior month
85
Home Demand Index
from prior year
from prior year
116
Months of
Inventory
Inventory
3.7
Average daily inventory last month
5,062
Inventory sold
last month
last month
1,377
Bright MLS | T3 Home Demand Index
www.homedemandindex.com
Note
1. This report is generated with data from the following counties:
- Central Pennsylvania – Adams, PA; Berks, PA; Cumberland, PA; Dauphin, PA; Franklin, PA; Fulton, PA; Lancaster, PA; Lebanon, PA; Perry, PA; Schuylkill, PA; York, PA;
- Ocean County – Ocean, NJ;
- Philadelphia Metro – Bucks, PA; Burlington, NJ; Camden, NJ; Chester, PA; Delaware, PA; Gloucester, NJ; Kent, DE; Mercer, NJ; Montgomery, PA; New Castle, DE; Philadelphia, PA;
- Salem-Cumberland – Cumberland, NJ; Salem, NJ;
2. This report is for the March 2023 period with data collected from the previous month.
Released: March 2, 2023
Reference ID: 1787
Philadelphia | March 2023
Home Demand Map (Zip Codes)
Demand for homes was Steady in Kent County and Slow across the other metro counties in Pennsylvania and Delaware. The Index for each of the New Jersey counties in the metro area was in the Limited category. Buyer activity was Steady in the Salem-Cumberland market area and at a Slow pace in Central Pennsylvania. Across the Greater Philadelphia area, buyer activity in 68 percent of ZIP codes was in the Slow or Limited range, a somewhat lower percentage than in January. In contrast, demand in just 10 percent of ZIP codes was in the High category.

Bright MLS | T3 Home Demand Index
www.homedemandindex.com