The Bright MLS | T3 Home Demand Index for the Philadelphia MLS market area rose 13 percent in February to a reading of Steady compared with a Slow pace of activity the previous month. Although the Index increased during the month, it was still 15 percent below the level one year earlier.
Buyer interest rose in February for each type of home tracked by the Bright MLS | T3 Home Demand Index. Demand for higher-priced condos and single-family homes rose the most over the month while buyer interest in lower-priced condos and single-family homes rose the least. The Index for mid-priced single-family homes, accounting for one-third of sales among all types of homes, was below the level one year earlier suggesting that this segment was off to a slower start this spring than last. Except for higher-priced condos, the months supply of homes for sale was three or lower, still very lean but in each case somewhat higher than the previous month.
Monthly Statistics for March 2021
Home Demand Index
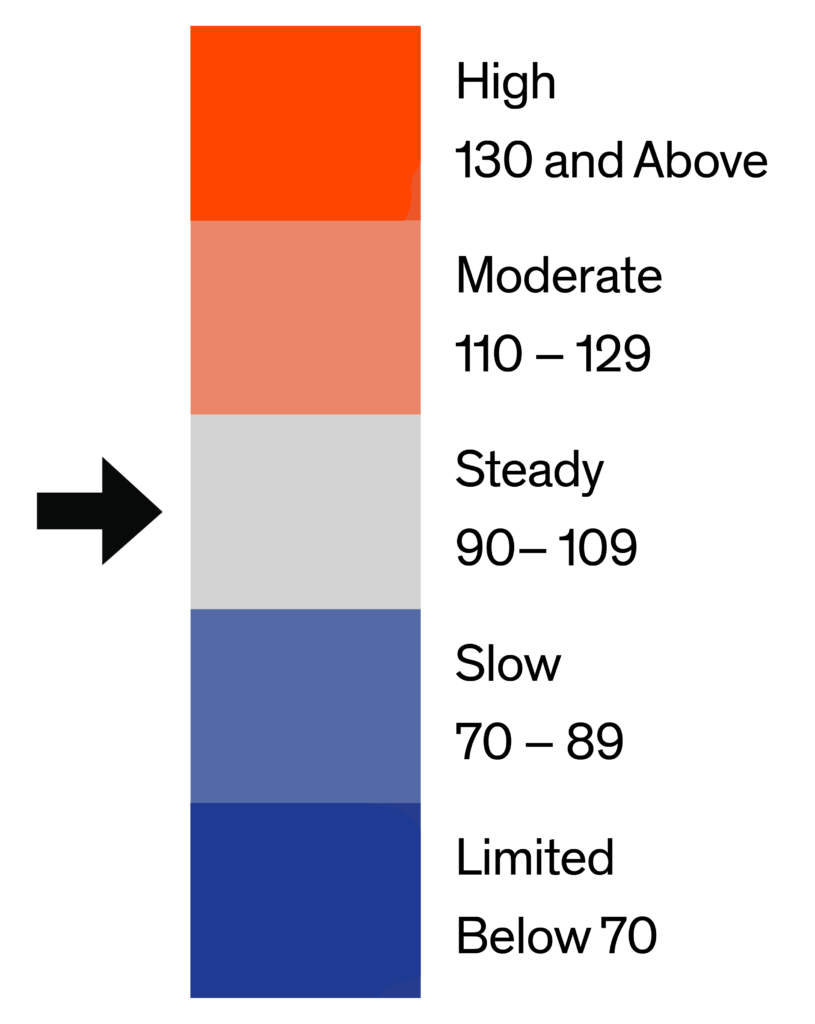
99
(Steady)
Home Demand Index from prior month
88
Home Demand Index from prior year
116
Index change from prior month
12.5%
Index change from same time last year
-14.7%
Bright MLS | T3 Home Demand Index
www.homedemandindex.com
Download tile as an image.
Embed this tile on your site.
Philadelphia | March 2021
Home Demand Index | Historical Year-over-Year Comparison
Demand for homes in the Philadelphia market area rose for the second consecutive month in February, suggesting that would-be buyers have increased their search activity in the run-up to the spring homebuying season. So far, the level of buyer interest in 2021 has been lower than in the same period last year before pandemic-related disruptions to the economy and the real estate market temporarily sidelined buyers.
Home Demand Index
Bright MLS | T3 Home Demand Index
www.homedemandindex.com
Download the top-level Market Areas map as a screenshot.
Embed this tile on your site.
Philadelphia | March 2021
Home Demand Map
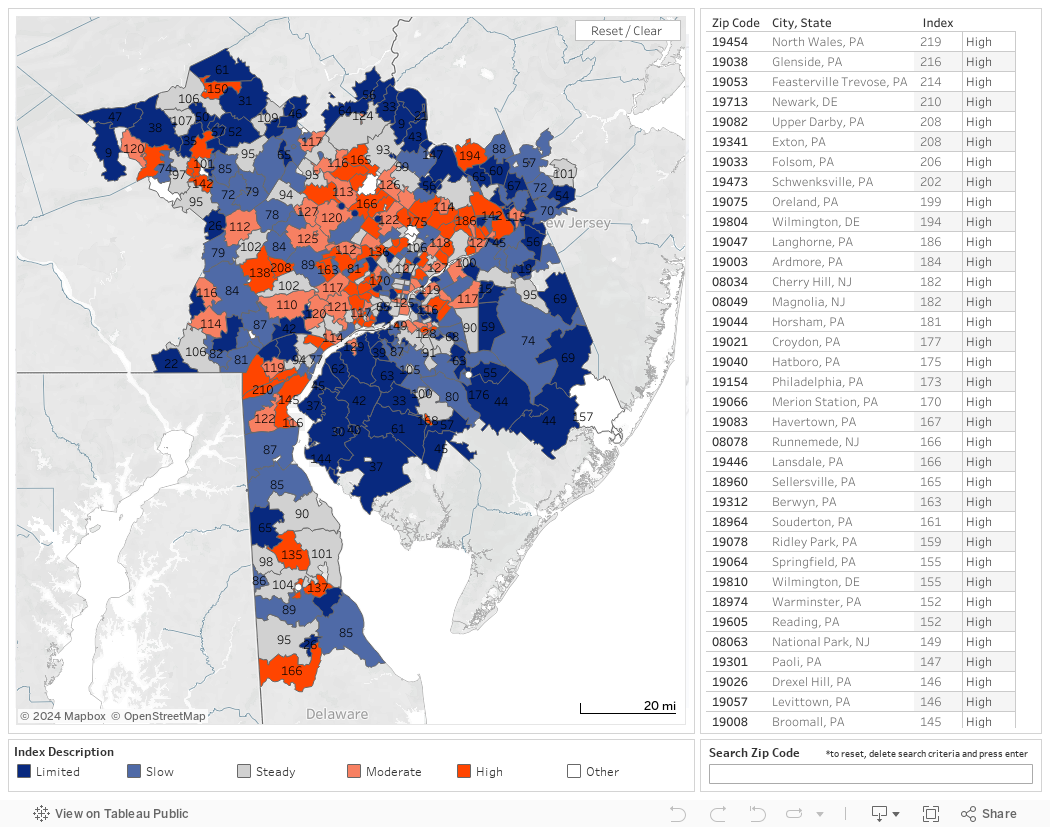
Buyer demand was High or Moderate among one-third of the ZIP codes in the Philadelphia market area in February. Most of these areas were concentrated in the Pennsylvania suburbs of Philadelphia with some representation in Delaware as well. More than 40 percent of ZIP codes were in the Slow or Limited category with many located in the New Jersey suburbs.
Bright MLS | T3 Home Demand Index
www.homedemandindex.com
Download tile as an image.
Embed this tile on your site.
Philadelphia | March 2021
Demand and Inventory by Home Type
Buyer interest rose in February for each type of home tracked by the Bright MLS | T3 Home Demand Index. Demand for higher-priced condos and single-family homes rose the most over the month while buyer interest in lower-priced condos and single-family homes rose the least. The Index for mid-priced single-family homes, accounting for one-third of sales among all types of homes, was below the level one year earlier suggesting that this segment was off to a slower start this spring than last. Except for higher-priced condos, the months supply of homes for sale was three or lower, still very lean but in each case somewhat higher than the previous month.
Bright MLS | T3 Home Demand Index
www.homedemandindex.com
Download tile as an image.
Philadelphia | March 2021
Single Family Home Below $195k
Buyer demand for lower-priced single-family homes remained in the Limited category in February, continuing a period of weakness that has persisted for several months. The Index rose by eight percent over the month but was roughly half the level of one year earlier. The inventory of homes available for sale, like most other segments of the Philadelphia market, was low with a months supply of 1.6, up from 1.3 months during the previous month.
Monthly Statistics for Single Family Home Below $195k
Home Demand Index
54
(Limited)
Home Demand Index from prior month
50
Home Demand Index from prior year
104
Months of inventory
1.6
Average daily inventory last month
686
Inventory sold last month
422
Bright MLS | T3 Home Demand Index
www.homedemandindex.com
Download tile as an image.
Philadelphia | March 2021
Single Family Home $195k - $485k
The Bright MLS | T3 Home Demand Index for mid-priced single-family homes rose to a reading of 99 in February, an increase of 13 percent over the month. Despite the rise, buyer interest was 12 percent below the level one year earlier. The months supply of homes available for sale has been lower than other single-family segments for the past several months. In February, the months supply was just 1.2, up marginally from a one-month supply the previous month.
Monthly Statistics for Single Family Home $195k - $485k
Home Demand Index
99
(Steady)
Home Demand Index from prior month
88
Home Demand Index from prior year
113
Months of Inventory
1.2
Average daily inventory last month
2,090
Inventory sold last month
1,787
Bright MLS | T3 Home Demand Index
www.homedemandindex.com
Download tile as an image.
Philadelphia | March 2021
Single Family Home Above $485k
Buyer interest in single-family homes priced above $485,000 rose 30 percent over the month reflecting a High level of demand. Inventory conditions were more favorable for buyers searching for homes in this price range compared with other single-family segments. There was a three-month supply in February, an increase from 2.1 the previous month.
Monthly Statistics for Single Family Home Above $485k
Home Demand Index
134
(High)
Home Demand Index from prior month
103
Home Demand Index from prior year
132
Months of Inventory
3
Average daily inventory last month
1,419
Inventory sold last month
478
Bright MLS | T3 Home Demand Index
www.homedemandindex.com
Download tile as an image.
Philadelphia | March 2021
Condo Below $360k
Demand for lower-priced condos rose marginally in February and remained in the Moderate category. The months supply of homes for sale, at 2.5, was up from 1.6 the previous month. While still low, inventory conditions were somewhat more favorable in this segment compared with similarly priced single-family homes.
Monthly Statistics for Condo Below $360k
Home Demand Index
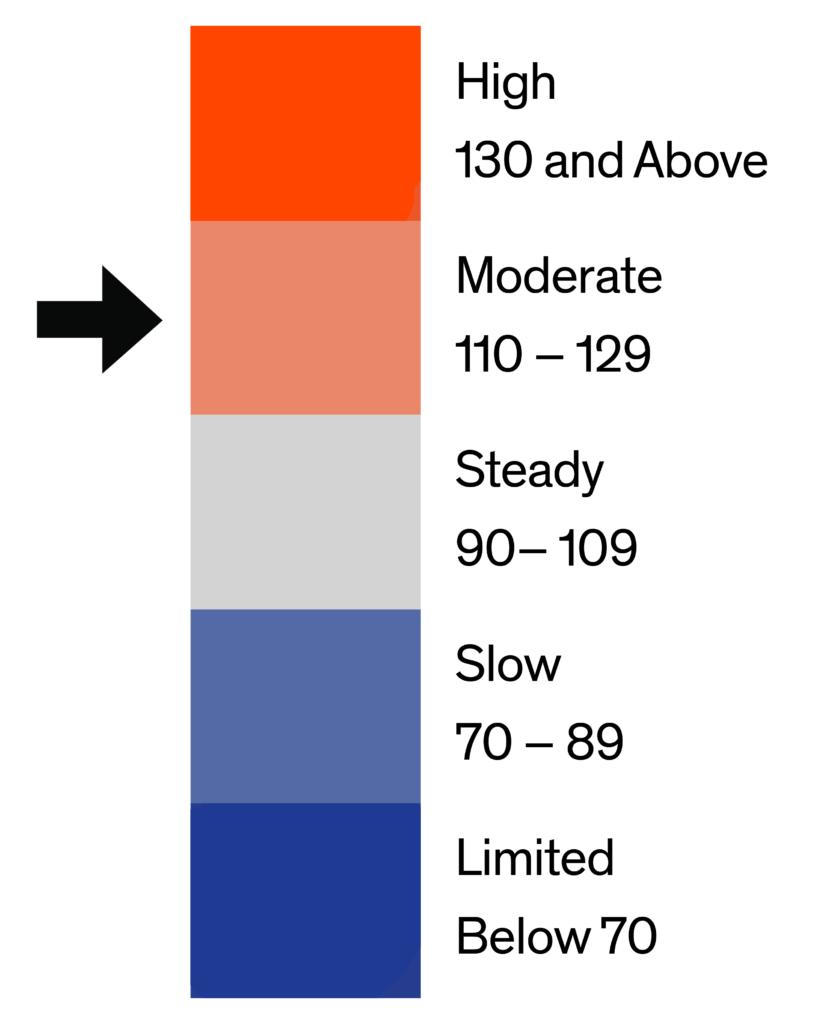
115
(Moderate)
Home Demand Index from prior month
110
Home Demand Index from prior year
118
Months of Inventory
2.5
Average daily inventory last month
749
Inventory sold last month
295
Bright MLS | T3 Home Demand Index
www.homedemandindex.com
This is Tooltip!
Philadelphia | March 2021
Condo Above $360k
Buyers searching for a condo priced above $360,000 found a more-than-adequate inventory of homes for sale, even as demand increased sharply over the month. The Index rose more than 50 percent over the month and was slightly ahead of the level one year earlier. The months supply of condos for sale was 11.2, an increase from nine the previous month.
Monthly Statistics for Condo Above $360k
Home Demand Index
162
(High)
Home Demand Index from prior month
106
Home Demand Index from prior year
157
Months of Inventory
11.2
Average daily inventory last month
346
Inventory sold last month
31
Bright MLS | T3 Home Demand Index
www.homedemandindex.com
This is Tooltip!
Philadelphia | March 2021
Townhouse/Rowhouse/Twin All prices
Townhouse/ Rowhouse/Twin All prices
Buyer demand for townhouses rose modestly in February but remained in the Steady category. Compared with one year earlier, demand was down just nine percent suggesting that this segment is tracking the increase in buyer interest experienced in last year’s spring market even if at a slightly lower level. Like most other market segments, the number of homes available for sale remained low with a months supply of two.
Monthly Statistics for Townhouse/Rowhouse/TwinAll prices
Home Demand Index
108
(Steady)
Home Demand Index from prior month
99
Home Demand Index from prior year
119
Months of Inventory
2
Average daily inventory last month
4,280
Inventory sold last month
2,181
Bright MLS | T3 Home Demand Index
www.homedemandindex.com
Note
1. This report is generated with data from the following counties: Berks, PA; Bucks, PA; Burlington, NJ; Camden, NJ; Chester, PA; Delaware, PA; Gloucester, NJ; Kent, DE; Mercer, NJ; Montgomery, PA; New Castle, DE; Philadelphia, PA; Salem, NJ
2. This report is for the March 2021 period with data collected from the previous month.
Released: March 11, 2021
Reference ID: 1142
Philadelphia | March 2021
Home Demand Map (Zip Codes)
Buyer demand was High or Moderate among one-third of the ZIP codes in the Philadelphia market area in February. Most of these areas were concentrated in the Pennsylvania suburbs of Philadelphia with some representation in Delaware as well. More than 40 percent of ZIP codes were in the Slow or Limited category with many located in the New Jersey suburbs.
Bright MLS | T3 Home Demand Index
www.homedemandindex.com
Embed the Timeline
To embed the map on your website, copy and paste the code below. Please note that the ideal dimensions for displaying the map are 1312 pixels wide by 660 pixels high.
Embed the Map
To embed the map on your website, copy and paste the code below. Please note that the ideal dimensions for displaying the map are 1312 pixels wide by 1182 pixels high.
Embed the Housing Type Bar Chart
To embed the map on your website, copy and paste the code below. Please note that the ideal dimensions for displaying the map are 1312 pixels wide by 880 pixels high.