June 2024 Report
Philadelphia Metro
Philadelphia | June 2024
Home Demand Index
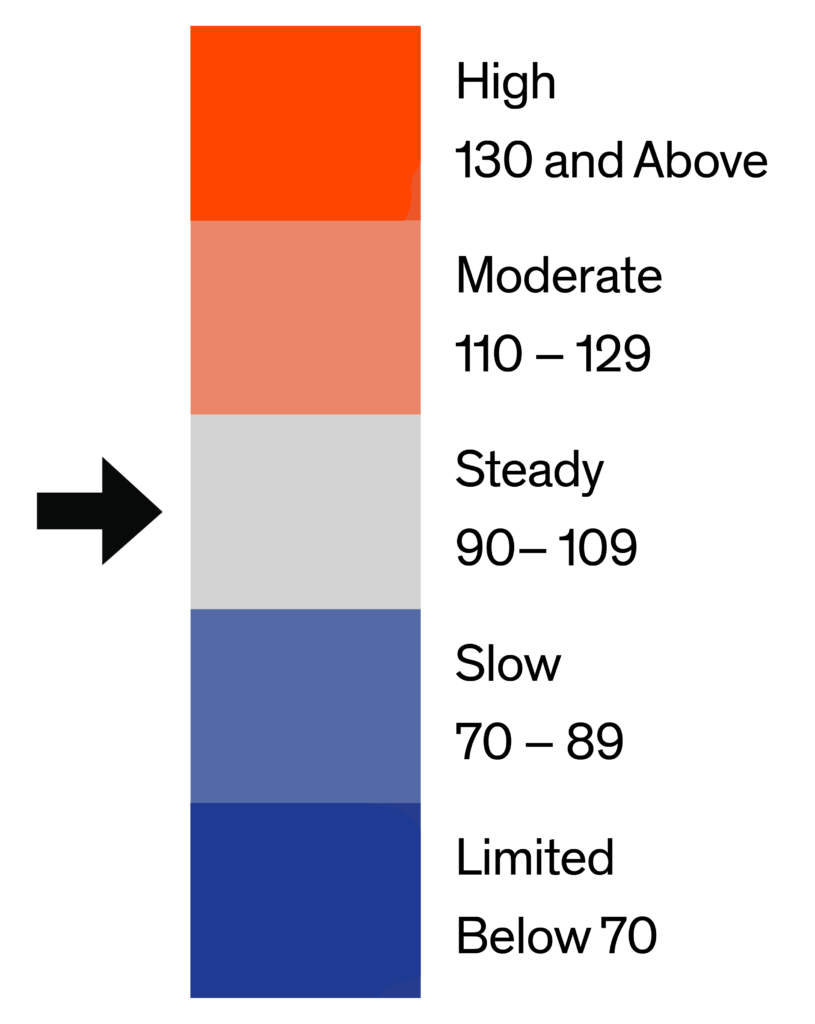
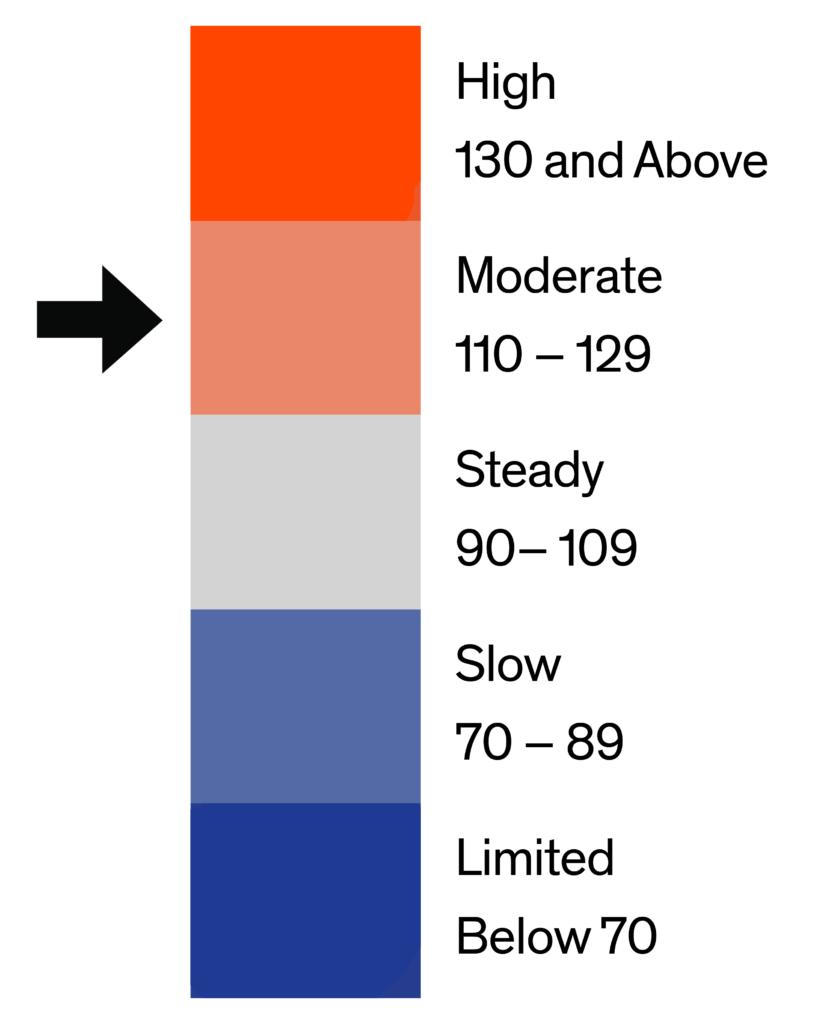
In this report period, the Overall Market Index for the Philadelphia Metro area stands at 85, down from 90 last month and 94 one year ago. This indicates a continued decline in buyer demand, reflecting broader market adjustments and economic conditions. Despite the decrease, the market maintains interest from buyers, indicating resilience in the current housing environment.
In the current report period, demand and inventory levels for various home types in Philadelphia show a diverse landscape. The demand for luxury single-family homes remained unchanged, indicating a Slow buyer interest in this segment. Meanwhile, entry-level condos saw a decline in demand, illustrating a shift in buyer preferences. Despite these variations, the overall market continues to grapple with limited inventory across most home types, sustaining competitive conditions for buyers.

Monthly Statistics for June 2024
Home Demand
Index
Index
85
(Slow)
Home Demand Index
from prior month
from prior month
90
Home Demand Index
from prior year
from prior year
94
Index change
from prior month
from prior month
-5.6%
Index change from
same time last year
same time last year
-9.6%
Bright MLS | T3 Home Demand Index
www.homedemandindex.com
Philadelphia | June 2024
Home Demand Index | Historical Year-over-Year Comparison
The Home Demand Index (HDI) for the Philadelphia Metro area shows a decline over the past year, with the current period’s index at 85, down from 90 last month and 94 one year ago. This year-over-year comparison indicates a gradual reduction in buyer interest, reflecting broader market trends and economic conditions. Despite these declines, the market demonstrates resilience as it navigates through fluctuating buyer activity levels.
Home Demand Index
Bright MLS | T3 Home Demand Index
www.homedemandindex.com
Philadelphia | June 2024
Home Demand Map
As of June 2024, both Philadelphia and Central Pennsylvania Metro Areas exhibit a “Slow” level of buyer interest, with HDIs of 85 and 87 respectively. This suggests subdued market activity in both regions. Meanwhile, Ocean County, with an HDI of 56, exhibits the weakest demand, indicating limited buyer interest. Conversely, Salem-Cumberland has the strongest demand with an HDI of 105, categorized as “Steady,” indicating a more stable demand for homes in this region.
Bright MLS | T3 Home Demand Index
www.homedemandindex.com
Philadelphia | June 2024
Demand and Inventory by Home Type
In the current report period, demand and inventory levels for various home types in Philadelphia show a diverse landscape. The demand for luxury single-family homes remained unchanged, indicating a Slow buyer interest in this segment. Meanwhile, entry-level condos saw a decline in demand, illustrating a shift in buyer preferences. Despite these variations, the overall market continues to grapple with limited inventory across most home types, sustaining competitive conditions for buyers.
Bright MLS | T3 Home Demand Index
www.homedemandindex.com
Philadelphia | June 2024
Single Family Home Below $328k
The index for single-family homes priced below $328K stands at 70 this month, down from 77 last month and significantly lower than last year’s 93, marking a 25% decrease year-over-year. This decline reflects a consistent Slow pace of buyer interest in this segment, likely due to ongoing affordability challenges and limited availability. The months supply, at 1.6 months, remains relatively unchanged, underscoring persistent inventory constraints.

Monthly Statistics for Single Family Home Below $328k
Home Demand
Index
Index
70
(Slow)
Home Demand Index
from prior month
from prior month
77
Home Demand Index
from prior year
from prior year
93
Months of
inventory
inventory
1.6
Average daily inventory last month
803
Inventory sold
last month
last month
508
Bright MLS | T3 Home Demand Index
www.homedemandindex.com
Philadelphia | June 2024
Single Family Home $328k - $730k
The index for mid-range single-family homes stands at 84 this month, slightly down from last month’s 86 and nearly on par with last year’s 85, indicating a consistent Slow pace of buyer interest. Despite this minor decline, the demand in this segment remains relatively steady, appealing to mid-market buyers. The months supply, at 1.4 months, underscores ongoing inventory constraints, contributing to the competitive market conditions.

Monthly Statistics for Single Family Home $328k - $730k
Home Demand
Index
Index
84
(Slow)
Home Demand Index
from prior month
from prior month
86
Home Demand Index
from prior year
from prior year
85
Months of
Inventory
Inventory
1.4
Average daily inventory last month
2,453
Inventory sold
last month
last month
1,721
Bright MLS | T3 Home Demand Index
www.homedemandindex.com
Philadelphia | June 2024
Single Family Home Above $730k
The index for luxury single-family homes remains unchanged at 88 this month, maintaining a Slow pace of buyer interest compared to last year’s 92. Despite the stable demand, this segment has not seen significant fluctuations, indicating consistent buyer activity within the high-end market. The months supply stands at 2.3, reflecting persistent inventory constraints amidst steady interest from luxury buyers.

Monthly Statistics for Single Family Home Above $730k
Home Demand
Index
Index
88
(Slow)
Home Demand Index
from prior month
from prior month
88
Home Demand Index
from prior year
from prior year
92
Months of
Inventory
Inventory
2.3
Average daily inventory last month
1,077
Inventory sold
last month
last month
461
Bright MLS | T3 Home Demand Index
www.homedemandindex.com
Philadelphia | June 2024
Condo Below $390k
The index for entry-level condos priced below $390K decreased to 95 this month, down from 100 last month but higher than the previous year’s 87. This indicates a Steady pace of demand despite the slight month-over-month decline, reflecting consistent interest from first-time buyers and investors. The months supply of homes stands at 2.9, up slightly from the previous month’s 2.7 months.

Monthly Statistics for Condo Below $390k
Home Demand
Index
Index
95
(Steady)
Home Demand Index
from prior month
from prior month
100
Home Demand Index
from prior year
from prior year
87
Months of
Inventory
Inventory
2.9
Average daily inventory last month
814
Inventory sold
last month
last month
278
Bright MLS | T3 Home Demand Index
www.homedemandindex.com
Philadelphia | June 2024
Condo Above $390k
The demand for luxury condos priced above $390K saw a slight decrease this month, with the index falling to 127 from 135 last month, yet it remains higher than last year’s 123. Despite this decline, buyer interest continues to be robust, reflecting a moderate pace of activity in this market segment. The months supply of homes stands at 5.1, down from 5.3 months the previous month, indicating a balanced market with adequate inventory.

Monthly Statistics for Condo Above $390k
Home Demand
Index
Index
127
(Moderate)
Home Demand Index
from prior month
from prior month
135
Home Demand Index
from prior year
from prior year
123
Months of
Inventory
Inventory
5.1
Average daily inventory last month
313
Inventory sold
last month
last month
61
Bright MLS | T3 Home Demand Index
www.homedemandindex.com
Philadelphia | June 2024
Townhouse/Rowhouse/Twin All prices
Townhouse/
Rowhouse/Twin
All prices
The index for townhouses, rowhouses, and twins is 89 this month, down from 96 last month and 103 last year. This indicates a steady decline in buyer interest over the year. The demand has shifted from Steady to Slow, reflecting the ongoing appeal of these home types in the current market. The months supply of homes decreased to 2.3 from 2.7 months.

Monthly Statistics for Townhouse/Rowhouse/TwinAll prices
Home Demand
Index
Index
89
(Slow)
Home Demand Index
from prior month
from prior month
96
Home Demand Index
from prior year
from prior year
103
Months of
Inventory
Inventory
2.3
Average daily inventory last month
5,171
Inventory sold
last month
last month
2,234
Bright MLS | T3 Home Demand Index
www.homedemandindex.com
Note
1. This report is generated with data from the following counties:
- Central Pennsylvania – Adams, PA; Berks, PA; Cumberland, PA; Dauphin, PA; Franklin, PA; Fulton, PA; Lancaster, PA; Lebanon, PA; Perry, PA; Schuylkill, PA; York, PA;
- Ocean County – Ocean, NJ;
- Philadelphia Metro – Bucks, PA; Burlington, NJ; Camden, NJ; Chester, PA; Delaware, PA; Gloucester, NJ; Kent, DE; Mercer, NJ; Montgomery, PA; New Castle, DE; Philadelphia, PA;
- Salem-Cumberland – Cumberland, NJ; Salem, NJ;
2. This report is for the June 2024 period with data collected from the previous month.
Released: June 11, 2024
Reference ID: 2055
Philadelphia | June 2024
Home Demand Map (Zip Codes)
As of June 2024, both Philadelphia and Central Pennsylvania Metro Areas exhibit a “Slow” level of buyer interest, with HDIs of 85 and 87 respectively. This suggests subdued market activity in both regions. Meanwhile, Ocean County, with an HDI of 56, exhibits the weakest demand, indicating limited buyer interest. Conversely, Salem-Cumberland has the strongest demand with an HDI of 105, categorized as “Steady,” indicating a more stable demand for homes in this region.

Bright MLS | T3 Home Demand Index
www.homedemandindex.com