June 2023 Report
Philadelphia Metro
Philadelphia | June 2023
Home Demand Index
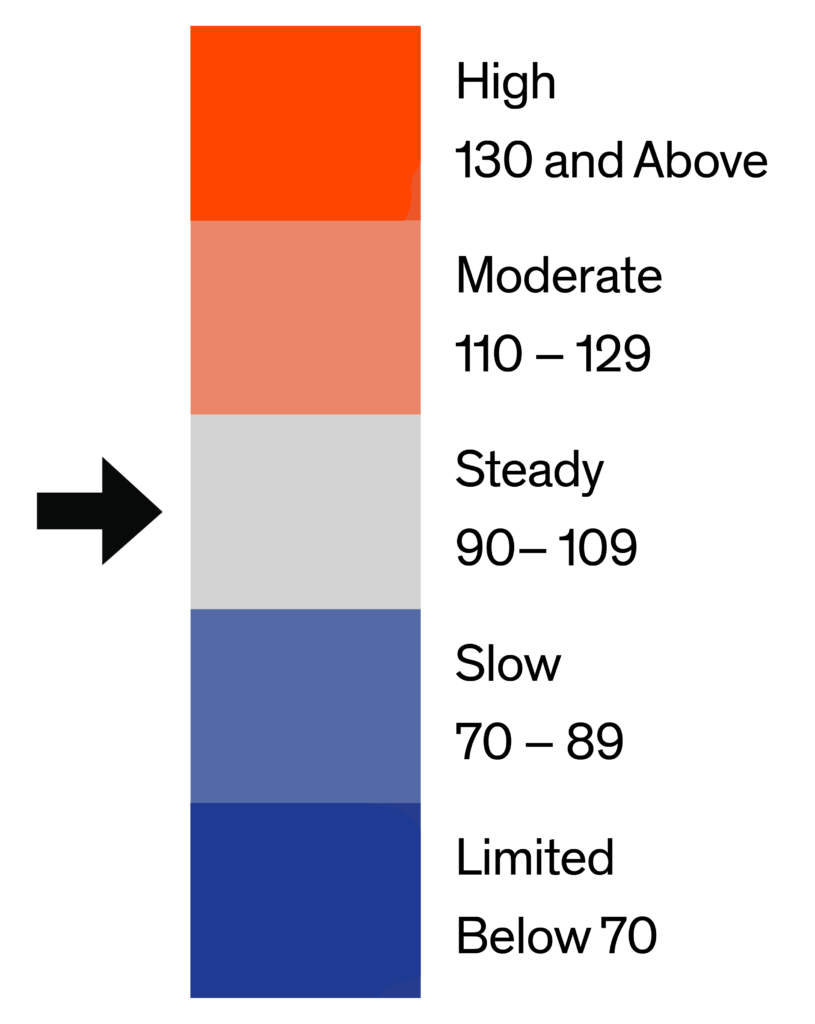
The Bright MLS | T3 Home Demand Index for the Philadelphia Metro area decreased 6.3 percent to 90 in May, reflecting a Steady pace of demand. Although easing over the month, buyer interest remained in the Steady category. The Index was 22.4 percent lower than one year earlier.
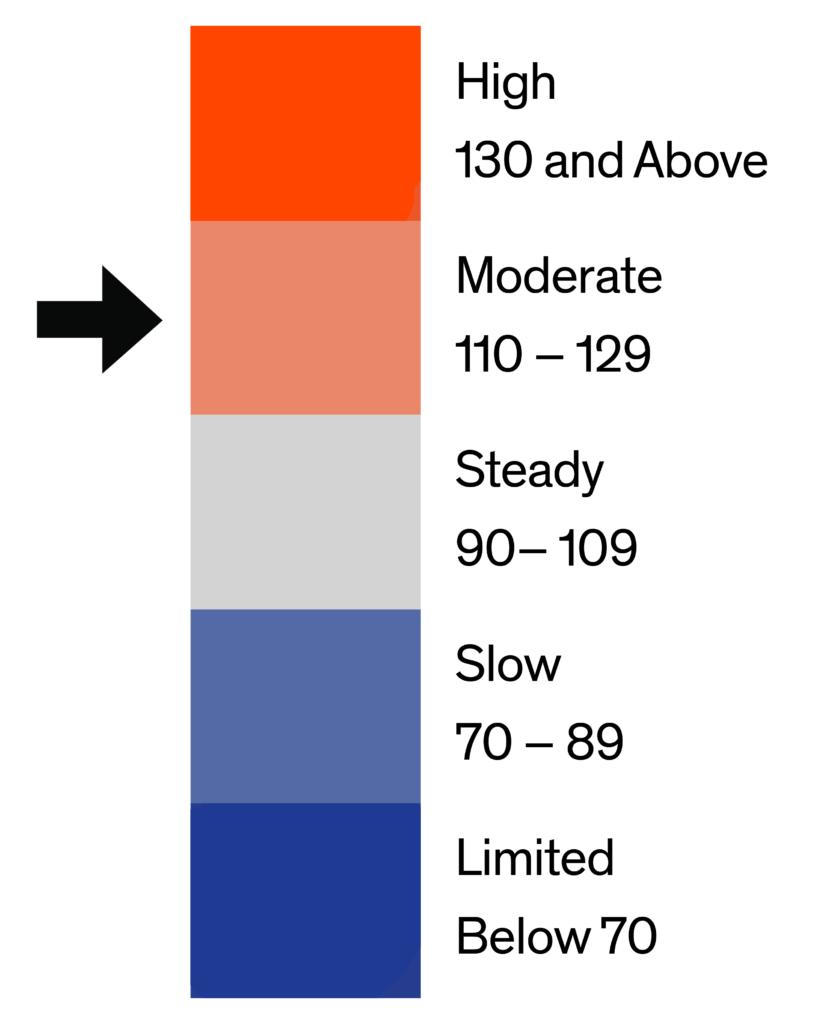
Demand fell for all types of homes except luxury single-family where the Index rose five percent over the month. Buyer interest decreased the most in the condo segments while demand for other types of homes was down slightly. There was a Moderate level of demand in luxury condos in May while all other segments attracted Slow or Steady interest among homebuyers. The months supply of homes for sales was flat or down among all segments of the market. The months supply ranged from a low of 1.3 months for mid-market single-family homes to a high of 4.9 months for luxury condos.

Monthly Statistics for June 2023
Home Demand
Index
Index
90
(Steady)
Home Demand Index
from prior month
from prior month
96
Home Demand Index
from prior year
from prior year
116
Index change
from prior month
from prior month
-6.3%
Index change from
same time last year
same time last year
-22.4%
Bright MLS | T3 Home Demand Index
www.homedemandindex.com
Philadelphia | June 2023
Home Demand Index | Historical Year-over-Year Comparison
Following a four-month increase the Index fell in May, a pattern consistent with softer demand approaching the middle of the year and after the height of the spring homebuying season. Compared with last year, demand was significantly lower, reaching a level of Steady demand in April compared with a Moderate pace of buyer interest last year. Although several forces have been at play in the market, higher mortgage rates and tight inventory conditions continued to be among the most challenging for buyers this spring.
Home Demand Index
Bright MLS | T3 Home Demand Index
www.homedemandindex.com
Philadelphia | June 2023
Home Demand Map
In the Philadelphia Metro area, demand for homes in Delaware and Montgomery counties remained in the Moderate category in May while buyer interest in the New Jersey portion of the metro area was in the Slow or Limited category. Demand was Steady across the rest of the metro area counties in Pennsylvania and Delaware. Buyer interest was Moderate in the Salem-Cumberland market area and Steady in Central Pennsylvania. Across the Greater Philadelphia area, demand was in the High or Moderate range in one-third of ZIP codes, unchanged from April. Buyer interest in half of ZIP codes was Slow or Limited.
Bright MLS | T3 Home Demand Index
www.homedemandindex.com
Philadelphia | June 2023
Demand and Inventory by Home Type
Demand fell for all types of homes except luxury single-family where the Index rose five percent over the month. Buyer interest decreased the most in the condo segments while demand for other types of homes was down slightly. There was a Moderate level of demand in luxury condos in May while all other segments attracted Slow or Steady interest among homebuyers. The months supply of homes for sales was flat or down among all segments of the market. The months supply ranged from a low of 1.3 months for mid-market single-family homes to a high of 4.9 months for luxury condos.
Bright MLS | T3 Home Demand Index
www.homedemandindex.com
Philadelphia | June 2023
Single Family Home Below $300k
Demand for entry-level single-family homes was down slightly, according to the Bright MLS | T3 Home Demand Index. The Index, at 87, was eight percent lower than April and reflected a Slow pace of buyer interest. The months supply was unchanged at 1.5 with both sales and the number of listings up somewhat compared with the month before.

Monthly Statistics for Single Family Home Below $300k
Home Demand
Index
Index
87
(Slow)
Home Demand Index
from prior month
from prior month
95
Home Demand Index
from prior year
from prior year
104
Months of
inventory
inventory
1.5
Average daily inventory last month
869
Inventory sold
last month
last month
567
Bright MLS | T3 Home Demand Index
www.homedemandindex.com
Philadelphia | June 2023
Single Family Home $300k - $672k
Buyer interest in mid-market single-family homes was down slightly over the month and remained in the Slow category of demand. The Index, at 82, was 29 percent lower than one year earlier. There was a 1.3 months supply of homes for sale in May, lower than any other segment of the Philadelphia market.

Monthly Statistics for Single Family Home $300k - $672k
Home Demand
Index
Index
82
(Slow)
Home Demand Index
from prior month
from prior month
87
Home Demand Index
from prior year
from prior year
115
Months of
Inventory
Inventory
1.3
Average daily inventory last month
2,061
Inventory sold
last month
last month
1,582
Bright MLS | T3 Home Demand Index
www.homedemandindex.com
Philadelphia | June 2023
Single Family Home Above $672k
The Index for luxury single-family homes rose marginally to 91 in May moving from Slow to Steady demand, the only segment of the metro area market to exhibit an increase in buyer interest over the month. The months supply, at 2.6, was down slightly over the month.

Monthly Statistics for Single Family Home Above $672k
Home Demand
Index
Index
91
(Steady)
Home Demand Index
from prior month
from prior month
87
Home Demand Index
from prior year
from prior year
119
Months of
Inventory
Inventory
2.6
Average daily inventory last month
1,017
Inventory sold
last month
last month
385
Bright MLS | T3 Home Demand Index
www.homedemandindex.com
Philadelphia | June 2023
Condo Below $376k
Buyer interest in entry-level condos fell 11 percent according to the Bright MLS | T3 Home Demand Index. Demand was in the Slow category and more than one-fifth lower than one year earlier. There was a 2.1 months supply of homes for sale, down from 2.6 months in April.

Monthly Statistics for Condo Below $376k
Home Demand
Index
Index
83
(Slow)
Home Demand Index
from prior month
from prior month
93
Home Demand Index
from prior year
from prior year
108
Months of
Inventory
Inventory
2.1
Average daily inventory last month
635
Inventory sold
last month
last month
307
Bright MLS | T3 Home Demand Index
www.homedemandindex.com
Philadelphia | June 2023
Condo Above $376k
The Index for luxury condos fell 17 percent in May with demand decreasing from High to Moderate over the month. Unlike other types of Philadelphia Metro area homes, which trailed the pace compared with one year earlier, the Index for luxury condos was 10 percent higher than last year. The months supply fell from 7.4 months in April to 4.9 months in May.

Monthly Statistics for Condo Above $376k
Home Demand
Index
Index
126
(Moderate)
Home Demand Index
from prior month
from prior month
151
Home Demand Index
from prior year
from prior year
115
Months of
Inventory
Inventory
4.9
Average daily inventory last month
322
Inventory sold
last month
last month
66
Bright MLS | T3 Home Demand Index
www.homedemandindex.com
Philadelphia | June 2023
Townhouse/Rowhouse/Twin All prices
Townhouse/
Rowhouse/Twin
All prices
Townhouse demand eased over the month with the Index falling eight percent to 99, a reading in the Steady demand category. Compared with one year earlier, the Index was 20 percent lower. Although both sales and the number of listings rose, the months supply fell from 2.8 months to 2.4 months.

Monthly Statistics for Townhouse/Rowhouse/TwinAll prices
Home Demand
Index
Index
99
(Steady)
Home Demand Index
from prior month
from prior month
108
Home Demand Index
from prior year
from prior year
124
Months of
Inventory
Inventory
2.4
Average daily inventory last month
5,314
Inventory sold
last month
last month
2,171
Bright MLS | T3 Home Demand Index
www.homedemandindex.com
Note
1. This report is generated with data from the following counties:
- Central Pennsylvania – Adams, PA; Berks, PA; Cumberland, PA; Dauphin, PA; Franklin, PA; Fulton, PA; Lancaster, PA; Lebanon, PA; Perry, PA; Schuylkill, PA; York, PA;
- Ocean County – Ocean, NJ;
- Philadelphia Metro – Bucks, PA; Burlington, NJ; Camden, NJ; Chester, PA; Delaware, PA; Gloucester, NJ; Kent, DE; Mercer, NJ; Montgomery, PA; New Castle, DE; Philadelphia, PA;
- Salem-Cumberland – Cumberland, NJ; Salem, NJ;
2. This report is for the June 2023 period with data collected from the previous month.
Released: June 11, 2023
Reference ID: 1844
Philadelphia | June 2023
Home Demand Map (Zip Codes)
In the Philadelphia Metro area, demand for homes in Delaware and Montgomery counties remained in the Moderate category in May while buyer interest in the New Jersey portion of the metro area was in the Slow or Limited category. Demand was Steady across the rest of the metro area counties in Pennsylvania and Delaware. Buyer interest was Moderate in the Salem-Cumberland market area and Steady in Central Pennsylvania. Across the Greater Philadelphia area, demand was in the High or Moderate range in one-third of ZIP codes, unchanged from April. Buyer interest in half of ZIP codes was Slow or Limited.

Bright MLS | T3 Home Demand Index
www.homedemandindex.com