Buyer interest in Philadelphia MLS market area homes was little changed in May compared with the previous month. The Bright MLS | T3 Home Demand Index, at 141, remained in the High demand category for the third consecutive month. Compared with the same month one year earlier, the Index was 36 percent higher, although the May 2020 reading reflects subdued home search activity during the early stages of the pandemic.
Buyer demand was in the High category in all market segments except lower-priced single-family homes where demand remained in the Limited category. Demand for single-family homes priced above $485,000 was particularly strong. Inventory conditions remained very tight among most types of homes tracked by the Index. The months supply ranged from 1.1 for mid-priced single-family homes to 4.1 for higher-priced condos. Except for a decline in higher-priced condos, the months supply was little changed for each type of home compared with April.
Monthly Statistics for June 2021
Home Demand Index
141
(High)
Home Demand Index from prior month
143
Home Demand Index from prior year
104
Index change from prior month
-1.4%
Index change from same time last year
35.6%
Bright MLS | T3 Home Demand Index
www.homedemandindex.com
Download tile as an image.
Embed this tile on your site.
Philadelphia | June 2021
Home Demand Index | Historical Year-over-Year Comparison
Even with softer overall demand in May, the Index has risen by 78 percent since the seasonal low in December. This strength of demand has been driven by low mortgage interest rates along with an improving economy, which has added urgency to would-be buyers’ search for a home. Moreover, buyer demand has exceeded year-earlier levels in 11 of the past 12 months.
Home Demand Index
Bright MLS | T3 Home Demand Index
www.homedemandindex.com
Download the top-level Market Areas map as a screenshot.
Embed this tile on your site.
Philadelphia | June 2021
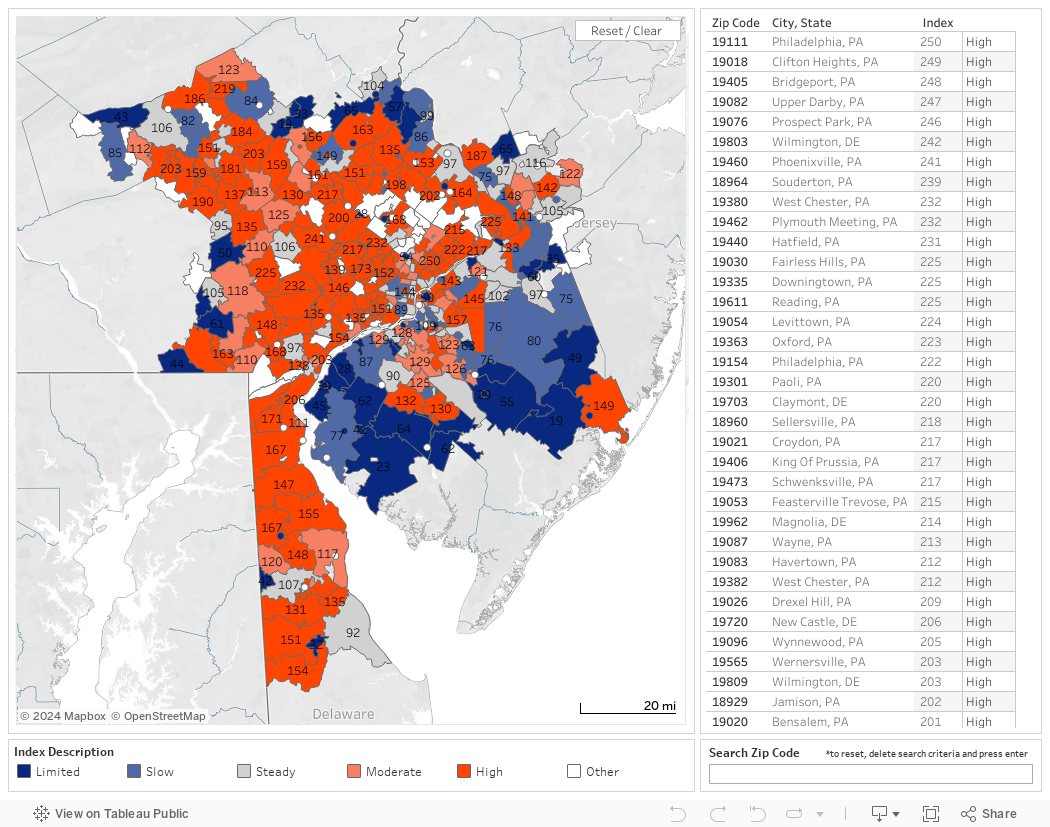
Home Demand Map
Nearly half of ZIP codes across the Philadelphia market area recorded an Index reading in the High category in May while only one-in-five were in the Slow or Limited category, in each instance largely unchanged from the previous month. Like the month before, areas of weaker demand were concentrated in the New Jersey portion of the market area and in a handful of communities mostly in the far northern and western suburbs.
Bright MLS | T3 Home Demand Index
www.homedemandindex.com
Download tile as an image.
Embed this tile on your site.
Philadelphia | June 2021
Demand and Inventory by Home Type
Buyer demand was in the High category in all market segments except lower-priced single-family homes where demand remained in the Limited category. Demand for single-family homes priced above $485,000 was particularly strong. Inventory conditions remained very tight among most types of homes tracked by the Index. The months supply ranged from 1.1 for mid-priced single-family homes to 4.1 for higher-priced condos. Except for a decline in higher-priced condos, the months supply was little changed for each type of home compared with April.
Bright MLS | T3 Home Demand Index
www.homedemandindex.com
Download tile as an image.
Philadelphia | June 2021
Single Family Home Below $195k
Demand for lower-priced single-family homes remained Limited in May with the Index falling marginally to 58 over the month. Despite generally strong demand for homes, would-be buyers in this price segment have only recently started to feel the positive effects of improved employment opportunities as the economic expansion broadened to more sectors. Additionally, with just five percent of all homes available for sale across the market area, home searchers at this price point have been hampered by low inventory, which in May translated into a months supply of 1.4.
Monthly Statistics for Single Family Home Below $195k
Home Demand Index
58
(Limited)
Home Demand Index from prior month
61
Home Demand Index from prior year
84
Months of inventory
1.4
Average daily inventory last month
641
Inventory sold last month
447
Bright MLS | T3 Home Demand Index
www.homedemandindex.com
Download tile as an image.
Philadelphia | June 2021
Single Family Home $195k - $485k
Buyer interest in mid-priced single-family homes was unchanged in May and remained High with an Index reading of 150. Although accounting for about one-quarter of homes for sale across the Philadelphia market area, strong buyer demand has resulted in challenging conditions with a months supply of only 1.1.
Monthly Statistics for Single Family Home $195k - $485k
Home Demand Index
150
(High)
Home Demand Index from prior month
150
Home Demand Index from prior year
111
Months of Inventory
1.1
Average daily inventory last month
2,792
Inventory sold last month
2,516
Bright MLS | T3 Home Demand Index
www.homedemandindex.com
Download tile as an image.
Philadelphia | June 2021
Single Family Home Above $485k
Buyer interest in higher-priced single-family homes rose marginally in May as indicated by an Index reading of 229, well above the threshold signaling High demand. In fact, demand was stronger than any other Philadelphia area segment tracked by the Bright MLS | T3 Home Demand Index. For buyers at this price point, inventory conditions were slightly more favorable than other single-family segments. The months supply in May was 2.1, unchanged from the previous month.
Monthly Statistics for Single Family Home Above $485k
Home Demand Index
229
(High)
Home Demand Index from prior month
227
Home Demand Index from prior year
125
Months of Inventory
2.1
Average daily inventory last month
1,945
Inventory sold last month
942
Bright MLS | T3 Home Demand Index
www.homedemandindex.com
Download tile as an image.
Philadelphia | June 2021
Condo Below $360k
Demand for lower-priced condos fell slightly in May but remained in the High category. The Index was significantly higher than one year earlier when many would-be buyers were deterred by the pandemic. Inventory conditions, although more favorable than similarly priced single-family segments, still hinderd buyers with a months supply of only 2.1.
Monthly Statistics for Condo Below $360k
Home Demand Index
143
(High)
Home Demand Index from prior month
148
Home Demand Index from prior year
92
Months of Inventory
2.1
Average daily inventory last month
891
Inventory sold last month
418
Bright MLS | T3 Home Demand Index
www.homedemandindex.com
This is Tooltip!
Philadelphia | June 2021
Condo Above $360k
Buyer interest in higher-priced condos softened in May. Despite the 13 percent decline in the Index to a reading of 176, demand remained in the High category. Would-be buyers in this relatively small segment of the market found an adequate supply of homes for sale with a months supply of 4.1 in May.
Monthly Statistics for Condo Above $360k
Home Demand Index
176
(High)
Home Demand Index from prior month
202
Home Demand Index from prior year
98
Months of Inventory
4.1
Average daily inventory last month
421
Inventory sold last month
102
Bright MLS | T3 Home Demand Index
www.homedemandindex.com
This is Tooltip!
Philadelphia | June 2021
Townhouse/Rowhouse/Twin All prices
Townhouse/ Rowhouse/Twin All prices
The Bright MLS | T3 Home Demand Index for townhouses decreased marginally in May to a reading of 145, still well-within the High demand category. Accounting for four-in-ten home sales in the Philadelphia market area, the townhouse segment drives a significant portion of home buying activity. Inventory conditions were largely unchanged over the month with a months supply of 1.7.
Monthly Statistics for Townhouse/Rowhouse/TwinAll prices
Home Demand Index
145
(High)
Home Demand Index from prior month
150
Home Demand Index from prior year
100
Months of Inventory
1.7
Average daily inventory last month
5,070
Inventory sold last month
2,972
Bright MLS | T3 Home Demand Index
www.homedemandindex.com
Note
1. This report is generated with data from the following counties: Berks, PA; Bucks, PA; Burlington, NJ; Camden, NJ; Chester, PA; Delaware, PA; Gloucester, NJ; Kent, DE; Mercer, NJ; Montgomery, PA; New Castle, DE; Philadelphia, PA; Salem, NJ
2. This report is for the June 2021 period with data collected from the previous month.
Released: June 10, 2021
Reference ID: 1275
Philadelphia | June 2021
Home Demand Map (Zip Codes)
Nearly half of ZIP codes across the Philadelphia market area recorded an Index reading in the High category in May while only one-in-five were in the Slow or Limited category, in each instance largely unchanged from the previous month. Like the month before, areas of weaker demand were concentrated in the New Jersey portion of the market area and in a handful of communities mostly in the far northern and western suburbs.
Bright MLS | T3 Home Demand Index
www.homedemandindex.com
Embed the Timeline
To embed the map on your website, copy and paste the code below. Please note that the ideal dimensions for displaying the map are 1312 pixels wide by 660 pixels high.
Embed the Map
To embed the map on your website, copy and paste the code below. Please note that the ideal dimensions for displaying the map are 1312 pixels wide by 1182 pixels high.
Embed the Housing Type Bar Chart
To embed the map on your website, copy and paste the code below. Please note that the ideal dimensions for displaying the map are 1312 pixels wide by 880 pixels high.