Share report on Facebook!
Share on facebook
Share report on Twitter!
Share on twitter
Share report on LinkedIn!
Share on linkedin
Email a link to this Report!
Share on email
Download tile as an image.

Philadelphia | July 2026

Home Demand Index

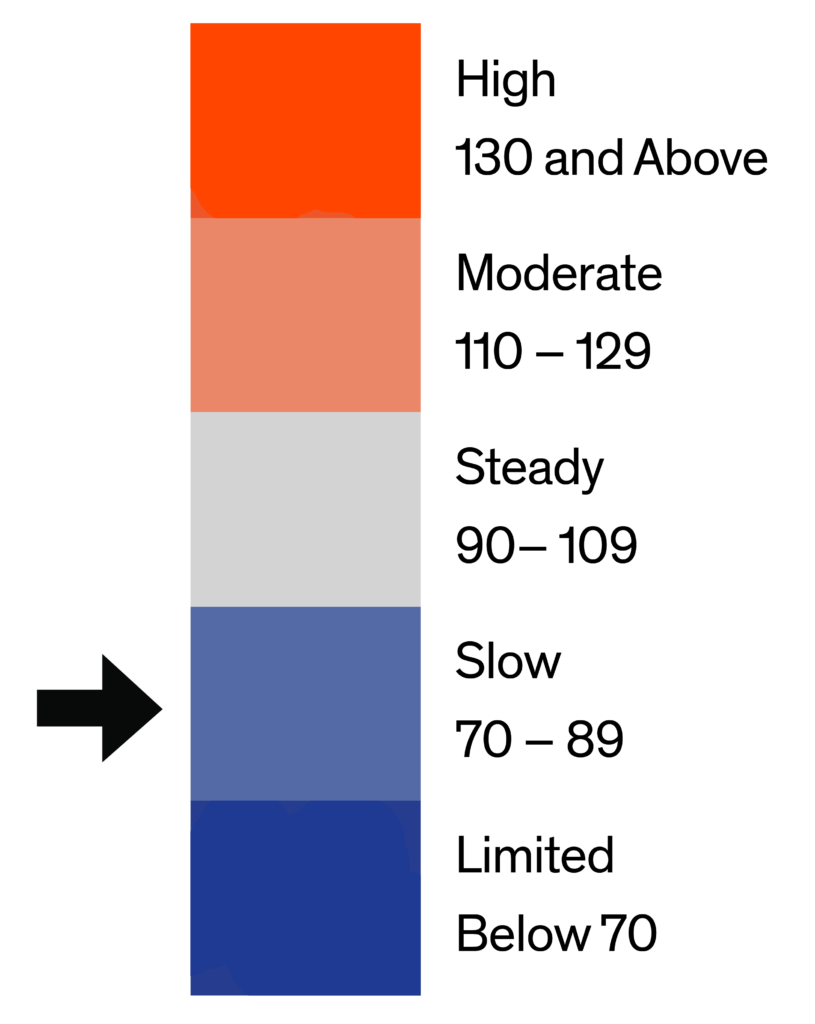
The Home Demand Index (HDI) for the Philadelphia metro area stands at 80 for this report period, flat with last month’s 80 and below the 88 recorded during the same period one year ago. The absence of month-over-month movement is itself a notable outcome, as the market typically experiences a meaningful deceleration following the spring peak as the active selling window narrows and buyer urgency associated with the seasonal transition dissipates, making the flat reading a relative outperformance against the seasonal pattern that suggests underlying demand in this market is more resilient entering the summer than the prior period reading alone would have implied. The eight-point year-over-year deficit is the narrowest annual gap recorded among the three metros covered in this report for the current period, indicating that Philadelphia is tracking closer to its prior-year baseline than either Baltimore or Washington DC, a dynamic that likely reflects the more modest seasonal peak that Philadelphia experienced in the prior year relative to those markets, which makes the prior-year comparison more achievable in the current period. The most significant development within the tier structure is the simultaneous breach of the 100-point Steady threshold by both condo segments, entry condo at 100 and luxury condo at 101, which represents the first time both attached tiers have reached Steady conditions simultaneously since the spring period and signals that the affordability migration from detached to attached housing is intensifying in a market where single-family affordability constraints are among the most pronounced in the region.
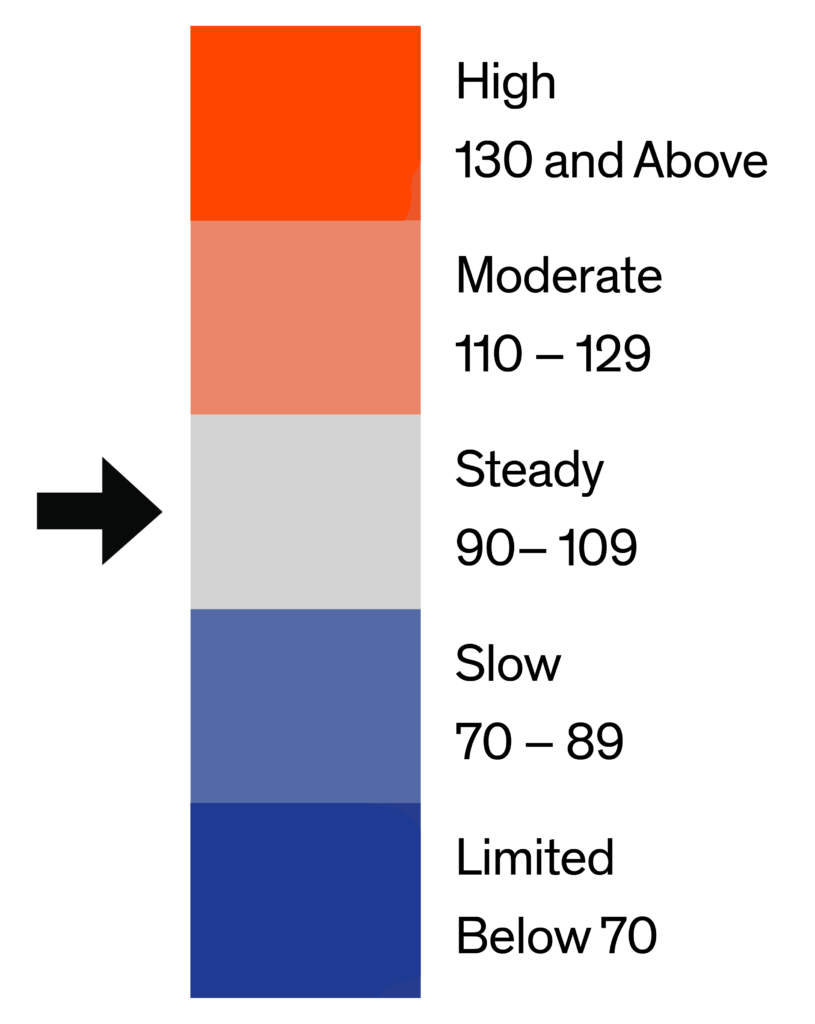
Demand by home type in Philadelphia this period presents a more constructive picture than the overall flat reading might suggest, with the tier structure showing meaningful divergence between strengthening attached segments and softening or stable detached categories that collectively produce the 80-point metro average. The most significant development is the simultaneous crossing of the Steady threshold by both condo tiers, entry condo at 100, up five points from last month, and luxury condo at 101, up six points from last month, representing the first simultaneous dual-condo Steady reading since April and confirming that the affordability-driven substitution dynamic that has characterized the Philadelphia market throughout the current cycle is continuing to intensify as single-family detached price points remain challenging for a broad swath of buyer cohorts. The single-family segments present a contrasting picture: entry SF at 70 is essentially flat with last month and continues to sit at the Limited-to-Slow boundary; mid SF at 77 ticked down one point in a minor sequential retreat; and luxury SF at 72 registered a nine-point month-over-month decline, dropping to its softest reading in several months and suggesting that high-end detached buyer activity in Philadelphia pulled back meaningfully following the spring peak. Townhouse, rowhouse, and twin home demand at 86 gained three points from last month, a modest but directionally constructive sequential improvement in the largest-volume segment of the market. The tier spread between the strongest reading (luxury condo at 101) and the weakest (luxury SF at 72) is the widest observed in recent reporting cycles for this metro and reflects a market where affordability dynamics are actively reshaping buyer composition.
Monthly Statistics for July 2026
Home Demand
Index
80
(Slow)
Home Demand Index
from prior month
80
Home Demand Index
from prior year
88
Index change
from prior month
0.0%
Index change from
same time last year
-9.1%
Bright MLS | T3 Home Demand Index

www.homedemandindex.com

Download tile as an image.
Embed this tile on your site.

Philadelphia | July 2026

Home Demand Index | Historical Year-over-Year Comparison

Over the past 12 months, Philadelphia’s Home Demand Index traced its characteristic seasonal arc, sustaining readings in the mid-80s through July and October before declining sharply through fall, reaching its seasonal floor of 47 in December before beginning a measured winter recovery that carried through January and February at 62 and 65, respectively, before a spring rebound pushed the index to 82 in March, 89 in April, and held at 80 through both May and June before registering 80 again in the current period. The pattern of identical 80-point readings across May and June is unusual and suggests that Philadelphia’s demand signal has reached a near-term equilibrium point where seasonal deceleration forces and the residual pull-forward from the spring buying cycle are roughly offsetting, resulting in a sustained plateau rather than the directional pullback that a more typical seasonal transition would produce. At 80, the index trails the 88 posted at this point last year by eight points, the narrowest year-over-year differential among the three metros this period and one that reflects both the relative modesty of Philadelphia’s 2025 summer cycle and the relative stability of the current-year reading. The prior-year comparison line for Philadelphia begins to soften meaningfully through the August and November corridor, suggesting that the year-over-year gap will narrow further and potentially converge as the 2025 fall and winter baseline declines.

Home Demand Index

Bright MLS | T3 Home Demand Index

www.homedemandindex.com

Download the top-level Market Areas map as a screenshot.

Embed this tile on your site.

Philadelphia | July 2026

Home Demand Map

Regional demand across the Philadelphia metro reflects the broad stabilization implied by the flat overall reading, with submarkets maintaining their established relative positions even as the seasonal transition from peak-selling to early-summer conditions reduces buyer urgency across geographies. The Steady cluster, anchored by Bucks, Montgomery, New Castle, Delaware, Kent, and Chester counties, continues to represent the strongest demand zones in the metro, supported by relatively resilient buyer activity, constrained inventory conditions, and household income profiles that support qualification at the mid-range price thresholds defining much of the available inventory in these markets. Philadelphia County is in Slow territory, where urban-core affordability constraints that have characterized this market throughout the current cycle continue to limit buyer activity in a context where elevated prices, persistent financing costs, and limited accessible inventory create a structural demand ceiling. Burlington, Camden, and Gloucester counties are tracking in Limited conditions, below the metro average, indicating that buyer engagement remains more restrained across these New Jersey submarkets as affordability pressures and softer participation weigh on demand momentum heading into the summer period. Mercer County registers the softest conditions in the metro, consistent with its position throughout the current cycle, as a combination of affordability challenges and muted buyer participation in the outer New Jersey corridor continues to suppress demand relative to surrounding markets.
Bright MLS | T3 Home Demand Index

www.homedemandindex.com

Download tile as an image.
Embed this tile on your site.

Philadelphia | July 2026

Demand and Inventory by Home Type

Demand by home type in Philadelphia this period presents a more constructive picture than the overall flat reading might suggest, with the tier structure showing meaningful divergence between strengthening attached segments and softening or stable detached categories that collectively produce the 80-point metro average. The most significant development is the simultaneous crossing of the Steady threshold by both condo tiers, entry condo at 100, up five points from last month, and luxury condo at 101, up six points from last month, representing the first simultaneous dual-condo Steady reading since April and confirming that the affordability-driven substitution dynamic that has characterized the Philadelphia market throughout the current cycle is continuing to intensify as single-family detached price points remain challenging for a broad swath of buyer cohorts. The single-family segments present a contrasting picture: entry SF at 70 is essentially flat with last month and continues to sit at the Limited-to-Slow boundary; mid SF at 77 ticked down one point in a minor sequential retreat; and luxury SF at 72 registered a nine-point month-over-month decline, dropping to its softest reading in several months and suggesting that high-end detached buyer activity in Philadelphia pulled back meaningfully following the spring peak. Townhouse, rowhouse, and twin home demand at 86 gained three points from last month, a modest but directionally constructive sequential improvement in the largest-volume segment of the market. The tier spread between the strongest reading (luxury condo at 101) and the weakest (luxury SF at 72) is the widest observed in recent reporting cycles for this metro and reflects a market where affordability dynamics are actively reshaping buyer composition.
Bright MLS | T3 Home Demand Index

www.homedemandindex.com

Download tile as an image.

Philadelphia | July 2026

Single Family Home Below $366k

The index for entry-level single-family homes in Philadelphia stands at 70 this report period, down one point from 71 last month and below the 84 recorded one year ago. The one-point month-over-month decline is directionally negative but operationally negligible, suggesting that entry single-family demand in Philadelphia has settled into a near-term holding pattern around the 70-point Limited-to-Slow boundary, a level that reflects the persistence of the affordability constraints that have defined this tier throughout the current cycle rather than any acute new deterioration in buyer engagement. At 1.8 months of inventory across 1,206 active listings and 672 monthly sales, supply conditions in this segment are tight in a manner more consistent with a Slow or Steady demand environment than the 70-point reading would imply, indicating that the index is being suppressed not by a surplus of available inventory but by the qualification and affordability barriers that prevent a larger pool of would-be buyers from converting intent into transactional activity. The fourteen-point year-over-year shortfall from the previous year’s reading of 84 is the relevant medium-term context: entry single-family demand in Philadelphia is tracking below the prior-year pace by a meaningful margin in a segment where affordability conditions have deteriorated rather than improved over the intervening twelve months, and any sustained recovery at this tier level remains acutely dependent on a movement in financing costs or the emergence of accessible inventory at price points that align with the constrained budgets of first-time and value-driven buyers in this market.
Monthly Statistics for Single Family Home Below $366k
Home Demand
Index
70
(Slow)
Home Demand Index
from prior month
71
Home Demand Index
from prior year
84
Months of
inventory
1.8
Average daily inventory last month
1,206
Inventory sold
last month
672
Bright MLS | T3 Home Demand Index

www.homedemandindex.com

Download tile as an image.

Philadelphia | July 2026

Single Family Home $366k - $812k

Mid-range single-family homes in the Philadelphia metro registered an index of 77 this report period, down one point from 78 last month and below last year’s reading of 83. The one-point month-over-month decline is the most modest sequential change across any segment in the Philadelphia market this period and is operationally consistent with a stable demand environment rather than a meaningful directional shift, a pattern that suggests move-up buyer activity in this tier has found a near-term equilibrium in the upper-70s range as the market transitions from the peak-selling window into early summer. At 1.7 months of inventory across 3,416 active listings and 2,010 monthly sales, the mid-range segment operates with the tightest supply conditions in the Philadelphia market and among the tightest across all three metros covered in this report, which provides a structural floor for demand index readings by limiting the degree to which buyers can adopt a more selective, wait-and-see posture. The six-point year-over-year shortfall from previous year’s 83 is the narrowest annual gap across all single-family tiers in the Philadelphia metro this period, indicating that mid-range demand has normalized more fully against the prior-year baseline than either the entry or luxury SF segments and is operating in a range consistent with the structural demand depth of established move-up households in this metro’s core suburban markets.
Monthly Statistics for Single Family Home $366k - $812k
Home Demand
Index
77
(Slow)
Home Demand Index
from prior month
78
Home Demand Index
from prior year
83
Months of
Inventory
1.7
Average daily inventory last month
3,416
Inventory sold
last month
2,010
Bright MLS | T3 Home Demand Index

www.homedemandindex.com

Download tile as an image.

Philadelphia | July 2026

Single Family Home Above $812k

The index for luxury single-family homes in Philadelphia stands at 72 this report period, down nine points from 81 last month and below last year’s reading of 82. The nine-point month-over-month decline is the most significant sequential retreat across any segment in the Philadelphia market this period and pushes luxury SF demand to within the Slow range, a meaningful deceleration from the spring-cycle readings when this tier briefly approached Steady conditions and one that confirms the discretionary nature of luxury buyer participation in a market where the seasonal transition from peak-urgency to early-summer pacing affects high-end decision-making more acutely than the underlying pricing or inventory conditions would suggest. At 2.0 months of inventory across 1,348 active listings and 668 monthly sales, supply conditions in this tier are moderate relative to the tight conditions observed at lower single-family price points, providing luxury buyers with a degree of selection flexibility that tends to reduce urgency and extend decision timelines into the summer months when competing lifestyle considerations naturally suppress market participation among this cohort. The ten-point year-over-year shortfall from previous year’s 82 reflects continued selectivity among high-end buyers compared to the prior-year period, with a divergence between the luxury SF and luxury condo segments that is widening rather than narrowing as the summer progresses.
Monthly Statistics for Single Family Home Above $812k
Home Demand
Index
72
(Slow)
Home Demand Index
from prior month
81
Home Demand Index
from prior year
82
Months of
Inventory
2.0
Average daily inventory last month
1,348
Inventory sold
last month
668
Bright MLS | T3 Home Demand Index

www.homedemandindex.com

Download tile as an image.

Philadelphia | July 2026

Condo Below $425k

Entry-level condo demand in Philadelphia stands at 100 this report period, up five points from 95 last month and below last year’s level of 109. The five-point month-over-month gain has pushed entry condo demand to exactly 100, the Steady threshold, for the first time since April, representing a notable inflection point in the structural affordability substitution dynamic that has characterized buyer behavior in this market throughout the current cycle, as first-time and value-oriented buyers who cannot access the sub-$366,000 detached single-family market at scale have increasingly directed demand into the attached inventory that offers more accessible entry thresholds in a sustained high-rate environment. At 3.6 months of inventory across 1,165 active listings and 325 monthly sales, the entry condo segment is operating with meaningfully more available inventory than the single-family tiers, a condition that typically supports buyer selectivity and suppresses demand index readings, which makes the 100-point Steady reading all the more significant as an indicator of genuine buyer conviction at this price point rather than urgency-driven activity in a constrained supply environment. The nine-point year-over-year shortfall from last year’s 109 provides the relevant historical context, though the current-period direction and the simultaneous Steady reading across both condo tiers suggest that the trend through the summer months may be more constructive than the annual comparison implies.
Monthly Statistics for Condo Below $425k
Home Demand
Index
100
(Steady)
Home Demand Index
from prior month
95
Home Demand Index
from prior year
109
Months of
Inventory
3.6
Average daily inventory last month
1,165
Inventory sold
last month
325
Bright MLS | T3 Home Demand Index

www.homedemandindex.com

This is Tooltip!

Philadelphia | July 2026

Condo Above $425k

Luxury condo demand in Philadelphia registered 101 this report period, up six points from 95 last month and below last year’s level of 105. The six-point month-over-month gain pushes luxury condo demand one point above the Steady threshold, making this the highest-indexed detached or attached segment in Philadelphia this period alongside the companion entry condo reading, and confirming that the attached market in Philadelphia is carrying disproportionate demand weight relative to the single-family tiers in the current environment. At 3.6 months of inventory across 293 active listings and 82 monthly sales, this is a thin market where supply characteristics make meaningful index movement achievable with relatively modest shifts in buyer participation, but the simultaneous Steady-threshold crossing by both condo tiers in the same period, a pattern not observed since spring, is a qualitatively meaningful signal that demand depth in the Philadelphia attached market is sustaining through the traditionally softer summer period rather than following the seasonal deceleration that has characterized the single-family segments. The four-point year-over-year shortfall from last year’s 105 is the narrowest annual gap across any segment in the Philadelphia market this period, indicating that luxury condo demand has normalized most fully against its prior-year baseline and is operating closest to a year-over-year equilibrium.
Monthly Statistics for Condo Above $425k
Home Demand
Index
101
(Steady)
Home Demand Index
from prior month
95
Home Demand Index
from prior year
105
Months of
Inventory
3.6
Average daily inventory last month
293
Inventory sold
last month
82
Bright MLS | T3 Home Demand Index

www.homedemandindex.com

This is Tooltip!

Philadelphia | July 2026

Townhouse/Rowhouse/Twin All prices

Townhouse/
Rowhouse/Twin
All prices

The index for townhouses, rowhouses, and twin homes in Philadelphia stands at 86 this report period, up three points from 83 last month and below last year’s level of 93. The three-point month-over-month gain is a modest sequential improvement that reflects the broadening of the counter-seasonal demand signal beyond the condo tiers into the attached single-family segment, consistent with the overall stability of Philadelphia’s 80-point metro reading and indicating that the market’s transition from peak-selling to early-summer conditions has not produced the demand retreat that a more typical July seasonal pattern would generate. At 3.1 months of inventory across 6,822 active listings and 2,224 monthly sales, the townhouse segment is the highest-volume component of the Philadelphia market by a wide margin and its three-point gain carries proportionally more weight for the metro-wide signal than the same movement would in a smaller-volume tier. The seven-point year-over-year shortfall from last year’s 93 reflects the more active prior-year summer cycle, though at 86 the segment is tracking at a level broadly consistent with its structural demand equilibrium, supported by its enduring appeal among buyers seeking a combination of space, location efficiency, and relative price accessibility in a metro where the attached single-family format continues to serve as a primary demand outlet for households that cannot or choose not to compete in the detached SF market at current price and financing cost levels.
Monthly Statistics for Townhouse/Rowhouse/TwinAll prices
Home Demand
Index
86
(Slow)
Home Demand Index
from prior month
83
Home Demand Index
from prior year
93
Months of
Inventory
3.1
Average daily inventory last month
6,822
Inventory sold
last month
2,224
Bright MLS | T3 Home Demand Index

www.homedemandindex.com

Note

1. This report is generated with data from the following counties:
  • Central Pennsylvania – Adams, PA; Berks, PA; Cumberland, PA; Dauphin, PA; Franklin, PA; Fulton, PA; Lancaster, PA; Lebanon, PA; Perry, PA; Schuylkill, PA; York, PA;
  • Ocean County – Ocean, NJ;
  • Philadelphia Metro – Bucks, PA; Burlington, NJ; Camden, NJ; Chester, PA; Delaware, PA; Gloucester, NJ; Kent, DE; Mercer, NJ; Montgomery, PA; New Castle, DE; Philadelphia, PA;
  • Salem-Cumberland – Cumberland, NJ; Salem, NJ;

2. This report is for the July 2026 period with data collected from the previous month.
Released: July 11, 2026
Reference ID: 2466

Philadelphia | July 2026

Home Demand Map (Zip Codes)

Regional demand across the Philadelphia metro reflects the broad stabilization implied by the flat overall reading, with submarkets maintaining their established relative positions even as the seasonal transition from peak-selling to early-summer conditions reduces buyer urgency across geographies. The Steady cluster, anchored by Bucks, Montgomery, New Castle, Delaware, Kent, and Chester counties, continues to represent the strongest demand zones in the metro, supported by relatively resilient buyer activity, constrained inventory conditions, and household income profiles that support qualification at the mid-range price thresholds defining much of the available inventory in these markets. Philadelphia County is in Slow territory, where urban-core affordability constraints that have characterized this market throughout the current cycle continue to limit buyer activity in a context where elevated prices, persistent financing costs, and limited accessible inventory create a structural demand ceiling. Burlington, Camden, and Gloucester counties are tracking in Limited conditions, below the metro average, indicating that buyer engagement remains more restrained across these New Jersey submarkets as affordability pressures and softer participation weigh on demand momentum heading into the summer period. Mercer County registers the softest conditions in the metro, consistent with its position throughout the current cycle, as a combination of affordability challenges and muted buyer participation in the outer New Jersey corridor continues to suppress demand relative to surrounding markets.
Bright MLS | T3 Home Demand Index

www.homedemandindex.com

Embed the Timeline

To embed the map on your website, copy and paste the code below. Please note that the ideal dimensions for displaying the map are 1312 pixels wide by 660 pixels high.

Embed the Map

To embed the map on your website, copy and paste the code below. Please note that the ideal dimensions for displaying the map are 1312 pixels wide by 1182 pixels high.

Embed the Housing Type Bar Chart

To embed the map on your website, copy and paste the code below. Please note that the ideal dimensions for displaying the map are 1312 pixels wide by 880 pixels high.