July 2021 Report
Philadelphia Metro
Philadelphia | July 2021
Home Demand Index
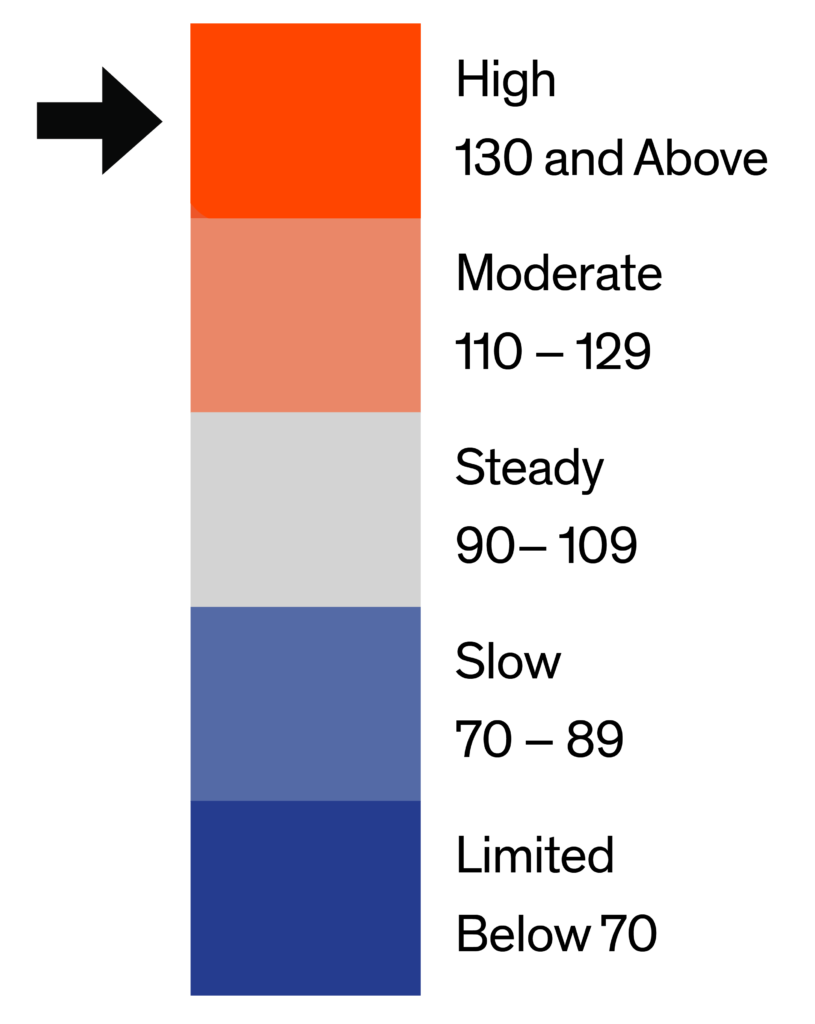
Demand for homes in the Philadelphia MLS market area was slightly lower in June according to the Bright MLS | T3 Home Demand Index. The Index fell by less than two percent over the month, to a reading of 139, and was virtually unchanged from the year before. June marked the fourth consecutive month with buyer demand in the High category.
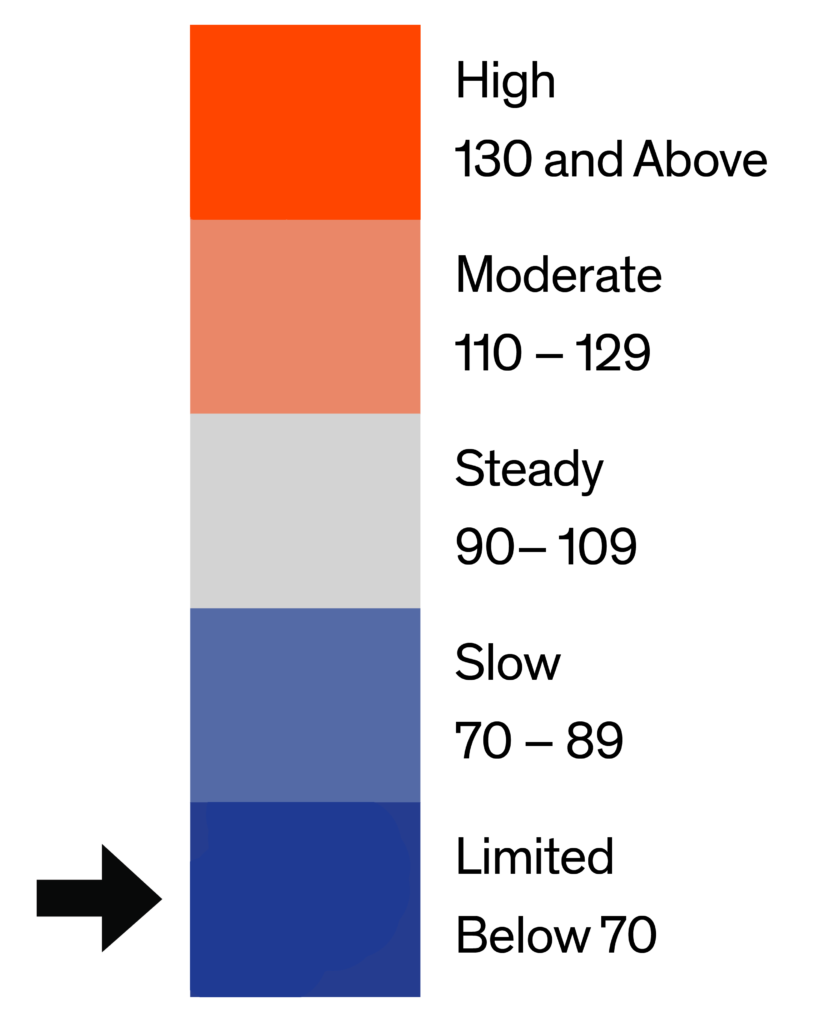
Buyer demand was in the High category in all segments except lower-priced single-family where demand remained in the Limited category. Buyer interest in higher-priced single-family homes rose over the month, the only market segment to record an increase in demand in June. The June months supply was lower among all types of homes except lower-priced single-family, which rose slightly. The months supply of higher-priced condos declined the most, from 4.1 in May to 3.1 months in June.

Monthly Statistics for July 2021
Home Demand
Index
Index
139
(High)
Home Demand Index
from prior month
from prior month
141
Home Demand Index
from prior year
from prior year
140
Index change
from prior month
from prior month
-1.4%
Index change from
same time last year
same time last year
-0.7%
Bright MLS | T3 Home Demand Index
www.homedemandindex.com
Philadelphia | July 2021
Home Demand Index | Historical Year-over-Year Comparison
Buyer demand for Philadelphia areas homes has softened somewhat during the past two months. The Index has decreased by three percent since April, likely due to a combination of factors including declining affordability as home prices continued to rise and limited inventory of homes available for sale at most price points. Demand has exceeded year-earlier levels for 10 of the past 12 months.
Home Demand Index
Bright MLS | T3 Home Demand Index
www.homedemandindex.com
Philadelphia | July 2021
Home Demand Map
Half of the ZIP codes across the Philadelphia market area recorded an Index in the High category in June while one-third were in the Moderate or Steady category. Like the month before, areas of weaker demand were concentrated in the New Jersey portion of the market area and in a handful of communities mostly in the far northern and western portions of the region.
Bright MLS | T3 Home Demand Index
www.homedemandindex.com
Philadelphia | July 2021
Demand and Inventory by Home Type
Buyer demand was in the High category in all segments except lower-priced single-family where demand remained in the Limited category. Buyer interest in higher-priced single-family homes rose over the month, the only market segment to record an increase in demand in June. The June months supply was lower among all types of homes except lower-priced single-family, which rose slightly. The months supply of higher-priced condos declined the most, from 4.1 in May to 3.1 months in June.
Bright MLS | T3 Home Demand Index
www.homedemandindex.com
Philadelphia | July 2021
Single Family Home Below $195k
The Bright MLS | T3 Home Demand Index for lower-priced single-family homes fell by 12 percent in June, marking the second consecutive drop in demand. Buyer interest in this segment has been Limited since last fall as would-be buyers in this segment confronted the economic fallout of the pandemic along with deteriorating affordability. The number of homes for sale remained relatively low in June with a months supply of 1.5, up from 1.4 in May.

Monthly Statistics for Single Family Home Below $195k
Home Demand
Index
Index
52
(Limited)
Home Demand Index
from prior month
from prior month
59
Home Demand Index
from prior year
from prior year
92
Months of
inventory
inventory
1.5
Average daily inventory last month
680
Inventory sold
last month
last month
458
Bright MLS | T3 Home Demand Index
www.homedemandindex.com
Philadelphia | July 2021
Single Family Home $195k - $485k
Buyer demand for mid-priced single-family homes in the Philadelphia market softened in June but remained in the High range. The Index was at nearly the same level as one year earlier. With elevated demand, the inventory of homes for sale has been drawn down. In June, the months supply was just 0.9, a decrease from 1.1 in May.

Monthly Statistics for Single Family Home $195k - $485k
Home Demand
Index
Index
145
(High)
Home Demand Index
from prior month
from prior month
151
Home Demand Index
from prior year
from prior year
146
Months of
Inventory
Inventory
0.9
Average daily inventory last month
3,176
Inventory sold
last month
last month
3,407
Bright MLS | T3 Home Demand Index
www.homedemandindex.com
Philadelphia | July 2021
Single Family Home Above $485k
Demand for higher-priced single-family homes was not only greater than any other type of Philadelphia area home tracked by the Index, but it also was the only segment to post an increase in June. In fact, June marked the fifth consecutive month of High demand. With continued strong buyer interest, the months supply fell to 1.5 months from 2.1 months in May.

Monthly Statistics for Single Family Home Above $485k
Home Demand
Index
Index
239
(High)
Home Demand Index
from prior month
from prior month
230
Home Demand Index
from prior year
from prior year
194
Months of
Inventory
Inventory
1.5
Average daily inventory last month
2,237
Inventory sold
last month
last month
1,509
Bright MLS | T3 Home Demand Index
www.homedemandindex.com
Philadelphia | July 2021
Condo Below $360k
Buyer interest in condos priced below $360,000 was little changed in June with an Index of 143. Demand has been in the High range since March. The inventory of condos for sale has not kept pace with sales resulting in falling months supply. In June, the inventory of condos for sale was equivalent to 1.8 months supply, down from 2.1 months in May.

Monthly Statistics for Condo Below $360k
Home Demand
Index
Index
143
(High)
Home Demand Index
from prior month
from prior month
144
Home Demand Index
from prior year
from prior year
133
Months of
Inventory
Inventory
1.8
Average daily inventory last month
900
Inventory sold
last month
last month
490
Bright MLS | T3 Home Demand Index
www.homedemandindex.com
Philadelphia | July 2021
Condo Above $360k
Demand for higher-price condos fell three percent in June according to the Bright MLS | T3 Home Demand Index. June marked the fifth consecutive month of High buyer interest in this segment. The elevated demand has resulted in rising sales and more challenging inventory conditions for buyers. The months supply was 3.1 in June, down from 4.1 in May, and as much as 11.2 months in February.

Monthly Statistics for Condo Above $360k
Home Demand
Index
Index
171
(High)
Home Demand Index
from prior month
from prior month
177
Home Demand Index
from prior year
from prior year
142
Months of
Inventory
Inventory
3.1
Average daily inventory last month
428
Inventory sold
last month
last month
138
Bright MLS | T3 Home Demand Index
www.homedemandindex.com
Philadelphia | July 2021
Townhouse/Rowhouse/Twin All prices
Townhouse/
Rowhouse/Twin
All prices
The Index for the townhouse segment decreased slightly to 142 in June. It was unchanged compared to one year earlier. Sales and inventory have been increasing in tandem during the spring buying season. In June, the months supply was 1.5, down from 1.7 in May, and within this range each month since March.

Monthly Statistics for Townhouse/Rowhouse/TwinAll prices
Home Demand
Index
Index
142
(High)
Home Demand Index
from prior month
from prior month
145
Home Demand Index
from prior year
from prior year
142
Months of
Inventory
Inventory
1.5
Average daily inventory last month
5,398
Inventory sold
last month
last month
3,595
Bright MLS | T3 Home Demand Index
www.homedemandindex.com
Note
1. This report is generated with data from the following counties:
- Central Pennsylvania – Adams, PA; Berks, PA; Cumberland, PA; Dauphin, PA; Franklin, PA; Fulton, PA; Lancaster, PA; Lebanon, PA; Perry, PA; Schuylkill, PA; York, PA;
- Ocean County – Ocean, NJ;
- Philadelphia Metro – Bucks, PA; Burlington, NJ; Camden, NJ; Chester, PA; Delaware, PA; Gloucester, NJ; Kent, DE; Mercer, NJ; Montgomery, PA; New Castle, DE; Philadelphia, PA;
- Salem-Cumberland – Cumberland, NJ; Salem, NJ;
2. This report is for the July 2021 period with data collected from the previous month.
Released: July 11, 2021
Reference ID: 1315
Philadelphia | July 2021
Home Demand Map (Zip Codes)
Half of the ZIP codes across the Philadelphia market area recorded an Index in the High category in June while one-third were in the Moderate or Steady category. Like the month before, areas of weaker demand were concentrated in the New Jersey portion of the market area and in a handful of communities mostly in the far northern and western portions of the region.
Bright MLS | T3 Home Demand Index
www.homedemandindex.com