The Bright MLS | T3 Home Demand Index decreased by 19 percent in December to a reading of 79, reflecting home demand that can be characterized as Slow in the Philadelphia MLS market area. Even against a backdrop of softening demand at year-end, the Index remained significantly higher compared to one year earlier. Pent-up demand and favorable financing options contributed to heightened buyer interest that persisted throughout the second half of 2020.
Reflecting the overall softening of demand in the Philadelphia market area, buyer interest for each type of home fell in December. Demand among most segments of the market was Slow or Steady, although lower-priced single-family homes posted a level of demand characterized as Limited. Among the single-family home segments, which accounted for more than half of sales during the month, the largest decrease in buyer interest was at the highest price point. Like previous months, inventory conditions were very tight among most home types.
Monthly Statistics for January 2021
Home Demand Index
79
(Slow)
Home Demand Index from prior month
98
Home Demand Index from prior year
60
Index change from prior month
-19.4%
Index change from same time last year
31.7%
Bright MLS | T3 Home Demand Index
www.homedemandindex.com
Download tile as an image.
Embed this tile on your site.
Philadelphia | January 2021
Home Demand Index | Historical Year-over-Year Comparison
For most of 2020, the Bright MLS | T3 Home Demand Index was higher compared to the same month in 2019. While the spring buying season was disrupted by the Covid-19 pandemic, demand quickly rebounded as buyers who were sidelined in their home search re-entered the market. Additionally, low mortgage interest rates further supported demand as buyers rushed to secure favorable financing. Although higher than year-earlier levels, the Index has now decreased for three consecutive months, tracking a similar seasonal decline in 2019.
Home Demand Index
Bright MLS | T3 Home Demand Index
www.homedemandindex.com
Download the top-level Market Areas map as a screenshot.
Embed this tile on your site.
Philadelphia | January 2021
Home Demand Map
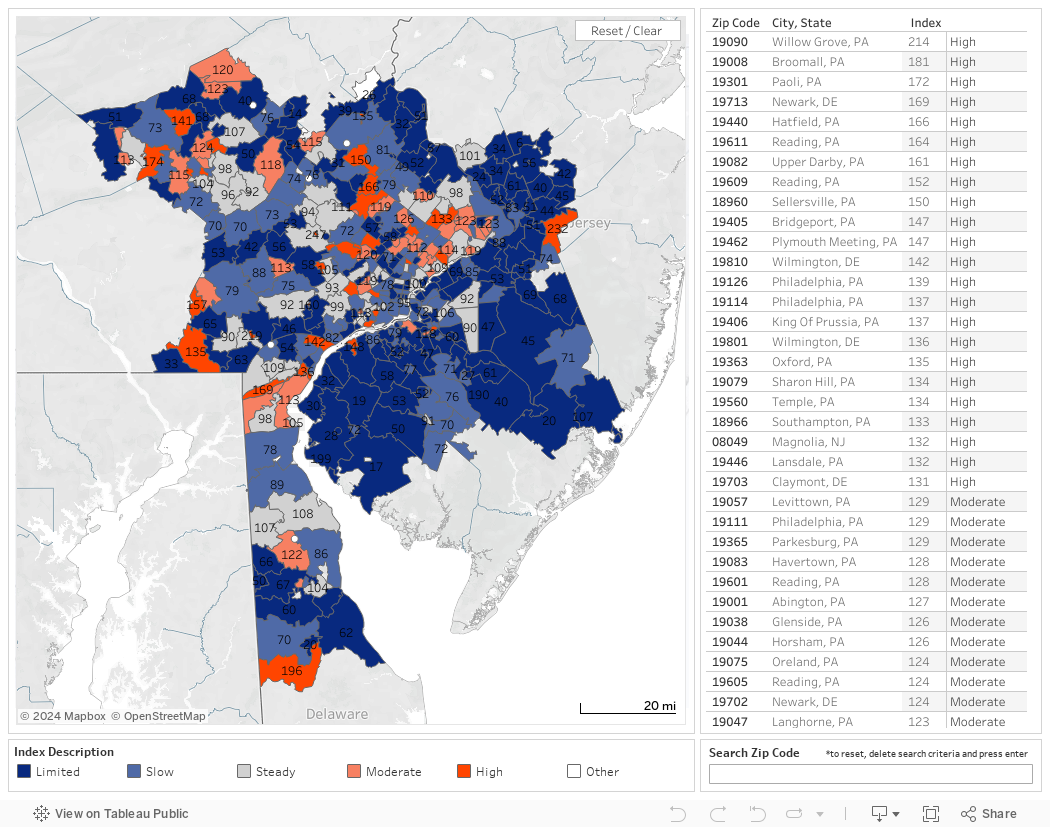
Across the more than 400 ZIP codes in the Philadelphia market area, fewer than one-in-five recorded a Bright MLS | T3 Home Demand Index score in the High or Moderate category. These were not concentrated in any specific area but rather were scattered throughout the region. Roughly 40 percent of ZIP codes logged an Index score categorized as Limited. There was a notable concentration of areas with Limited buyer interest in southern New Jersey and central Delaware.
Bright MLS | T3 Home Demand Index
www.homedemandindex.com
Download tile as an image.
Embed this tile on your site.
Philadelphia | January 2021
Demand and Inventory by Home Type
Reflecting the overall softening of demand in the Philadelphia market area, buyer interest for each type of home fell in December. Demand among most segments of the market was Slow or Steady, although lower-priced single-family homes posted a level of demand characterized as Limited. Among the single-family home segments, which accounted for more than half of sales during the month, the largest decrease in buyer interest was at the highest price point. Like previous months, inventory conditions were very tight among most home types.
Bright MLS | T3 Home Demand Index
www.homedemandindex.com
Download tile as an image.
Philadelphia | January 2021
Single Family Home Below $195k
Buyer interest in single-family homes priced below $195,000 decreased by 17 percent in December compared to November. While the most recent decline was consistent with a softening of demand across the entire market, this segment also experienced a significant decline during the past several months. The latest Index reading, at 49, reflected Limited buyer interest. Even with a lower level of demand, homes for sale were snapped up quickly as reflected by a months supply of just 1.2.
Monthly Statistics for Single Family Home Below $195k
Home Demand Index
49
(Limited)
Home Demand Index from prior month
59
Home Demand Index from prior year
68
Months of inventory
1.2
Average daily inventory last month
941
Inventory sold last month
762
Bright MLS | T3 Home Demand Index
www.homedemandindex.com
Download tile as an image.
Philadelphia | January 2021
Single Family Home $195k - $485k
Demand for mid-priced single-family homes decreased by 24 percent in December. Although the Index fell to a reading of 78, buyer interest remained stronger than one year earlier. The underlying strength of demand resulted in a rapid turnover of properties even as buyer interest softened. With a months supply of just 0.9, buyers faced a daunting task when searching for a home.
Monthly Statistics for Single Family Home $195k - $485k
Home Demand Index
78
(Slow)
Home Demand Index from prior month
103
Home Demand Index from prior year
57
Months of Inventory
0.9
Average daily inventory last month
2,817
Inventory sold last month
3,226
Bright MLS | T3 Home Demand Index
www.homedemandindex.com
Download tile as an image.
Philadelphia | January 2021
Single Family Home Above $485k
Like most other segments, the upper end of the single-family market experienced a decline in buyer interest in December. The Bright MLS | T3 Home Demand Index fell by 29 percent to a level of 80 reflecting a Slow pace of buyer demand. Demand remained above the level one year earlier, however. Although more favorable compared with other single-family segments, inventory conditions were challenging with a months supply of just 1.8.
Monthly Statistics for Single Family Home Above $485k
Home Demand Index
80
(Slow)
Home Demand Index from prior month
112
Home Demand Index from prior year
44
Months of Inventory
1.8
Average daily inventory last month
1,750
Inventory sold last month
958
Bright MLS | T3 Home Demand Index
www.homedemandindex.com
Download tile as an image.
Philadelphia | January 2021
Condo Below $360k
Buyer interest in the lower-priced condo segment fell by 10 percent in December but was still 53 percent ahead of one year earlier. With a reading of 95, the Index was in the Steady category. Inventory conditions continued to favor sellers with a months supply of 2.3.
Monthly Statistics for Condo Below $360k
Home Demand Index
95
(Steady)
Home Demand Index from prior month
106
Home Demand Index from prior year
62
Months of Inventory
2.3
Average daily inventory last month
1,185
Inventory sold last month
510
Bright MLS | T3 Home Demand Index
www.homedemandindex.com
This is Tooltip!
Philadelphia | January 2021
Condo Above $360k
The Bright MLS | T3 Home Demand Index for higher-priced condos, a small segment of the overall market, fell 12 percent over the month to a reading of 80. The Index remained elevated compared to one year earlier, however. Buyers in this segment of the condo market found adequate inventory, with a months supply of seven.
Monthly Statistics for Condo Above $360k
Home Demand Index
80
(Slow)
Home Demand Index from prior month
91
Home Demand Index from prior year
56
Months of Inventory
7
Average daily inventory last month
365
Inventory sold last month
52
Bright MLS | T3 Home Demand Index
www.homedemandindex.com
This is Tooltip!
Philadelphia | January 2021
Townhouse/Rowhouse/Twin All prices
Townhouse/ Rowhouse/Twin All prices
The Bright MLS | T3 Home Demand Index for the townhouse segment decreased by 14 percent to 89, placing the level of buyer interest in the Slow category. Favorable market factors, however, have supported this segment which, despite the monthly decline, was still 39 percent ahead of one year earlier. The months supply of homes available for sale was, like most other segments, lean at 1.6.
Monthly Statistics for Townhouse/Rowhouse/TwinAll prices
Home Demand Index
89
(Slow)
Home Demand Index from prior month
104
Home Demand Index from prior year
64
Months of Inventory
1.6
Average daily inventory last month
5,415
Inventory sold last month
3,393
Bright MLS | T3 Home Demand Index
www.homedemandindex.com
Note
1. This report is generated with data from the following counties: Berks, PA; Bucks, PA; Burlington, NJ; Camden, NJ; Chester, PA; Delaware, PA; Gloucester, NJ; Kent, DE; Mercer, NJ; Montgomery, PA; New Castle, DE; Philadelphia, PA; Salem, NJ
2. This report is for the January 2021 period with data collected from the previous month.
Released: March 4, 2021
Reference ID: 1018
Philadelphia | January 2021
Home Demand Map (Zip Codes)
Across the more than 400 ZIP codes in the Philadelphia market area, fewer than one-in-five recorded a Bright MLS | T3 Home Demand Index score in the High or Moderate category. These were not concentrated in any specific area but rather were scattered throughout the region. Roughly 40 percent of ZIP codes logged an Index score categorized as Limited. There was a notable concentration of areas with Limited buyer interest in southern New Jersey and central Delaware.
Bright MLS | T3 Home Demand Index
www.homedemandindex.com
Embed the Timeline
To embed the map on your website, copy and paste the code below. Please note that the ideal dimensions for displaying the map are 1312 pixels wide by 660 pixels high.
Embed the Map
To embed the map on your website, copy and paste the code below. Please note that the ideal dimensions for displaying the map are 1312 pixels wide by 1182 pixels high.
Embed the Housing Type Bar Chart
To embed the map on your website, copy and paste the code below. Please note that the ideal dimensions for displaying the map are 1312 pixels wide by 880 pixels high.