The Bright MLS | T3 Home Demand Index rose by 11 percent in January recording a Slow pace of buyer demand for homes in the Philadelphia MLS market area. While the Index rose over the month, it remained below the level of one year earlier.
Most types of homes in the Philadelphia market area recorded a Bright MLS | T3 Home Demand Index score in the Steady category. While demand did not decrease among any home types, the range of increases over the month was mixed. There was no change in the Index for lower-priced single-family homes while higher-priced single-family and higher-priced condos each recorded an increase in buyer demand of more than 25 percent. Except for higher-priced condos, a small segment of the market, the months supply was at 2.1 or less.
Monthly Statistics for February 2021
Home Demand Index
88
(Slow)
Home Demand Index from prior month
79
Home Demand Index from prior year
96
Index change from prior month
11.4%
Index change from same time last year
-8.3%
Bright MLS | T3 Home Demand Index
www.homedemandindex.com
Download tile as an image.
Embed this tile on your site.
Philadelphia | February 2021
Home Demand Index | Historical Year-over-Year Comparison
During the second half of 2020, buyer interest was significantly higher than the previous year, supported by low mortgage interest rates and buyers’ response to pandemic-related changes in the job market, such as increased work-from-home. Demand for homes rose in January, following a three-month decline, a prelude to the start of the spring market as buyers began searching for homes in anticipation of closing a sale in the early months of 2021. Despite the increase over the month, demand was below the level one year earlier for the first time since May.
Home Demand Index
Bright MLS | T3 Home Demand Index
www.homedemandindex.com
Download the top-level Market Areas map as a screenshot.
Embed this tile on your site.
Philadelphia | February 2021
Home Demand Map
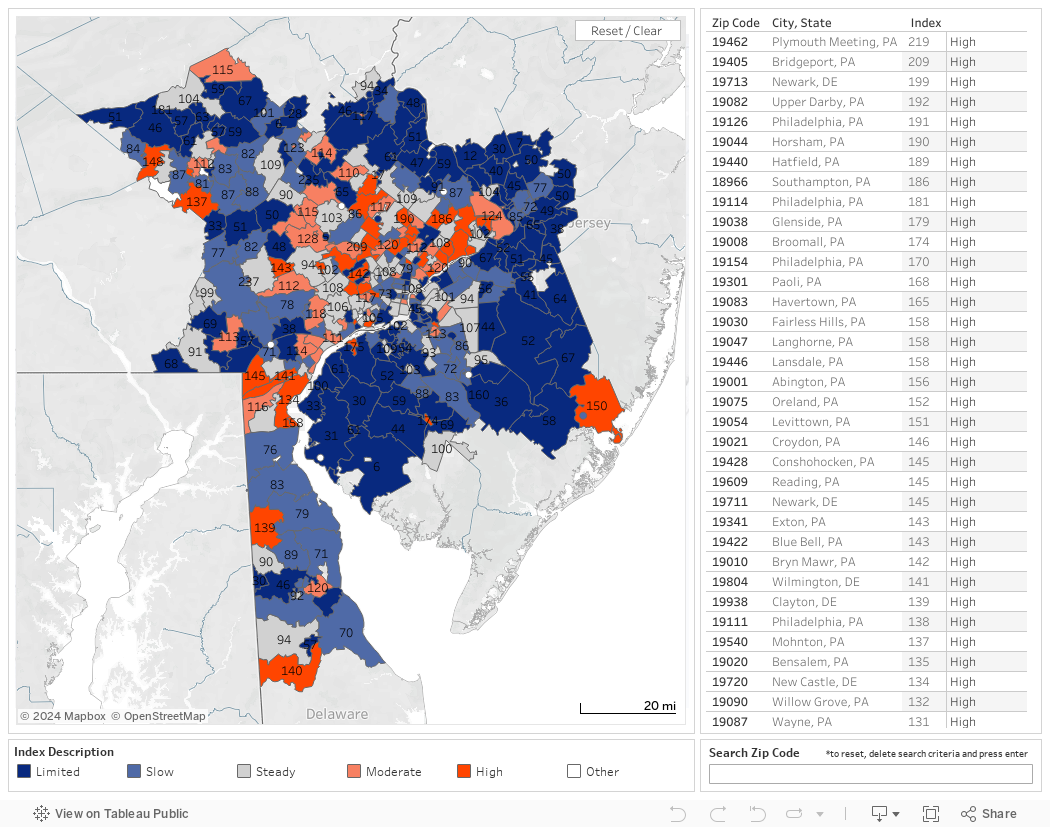
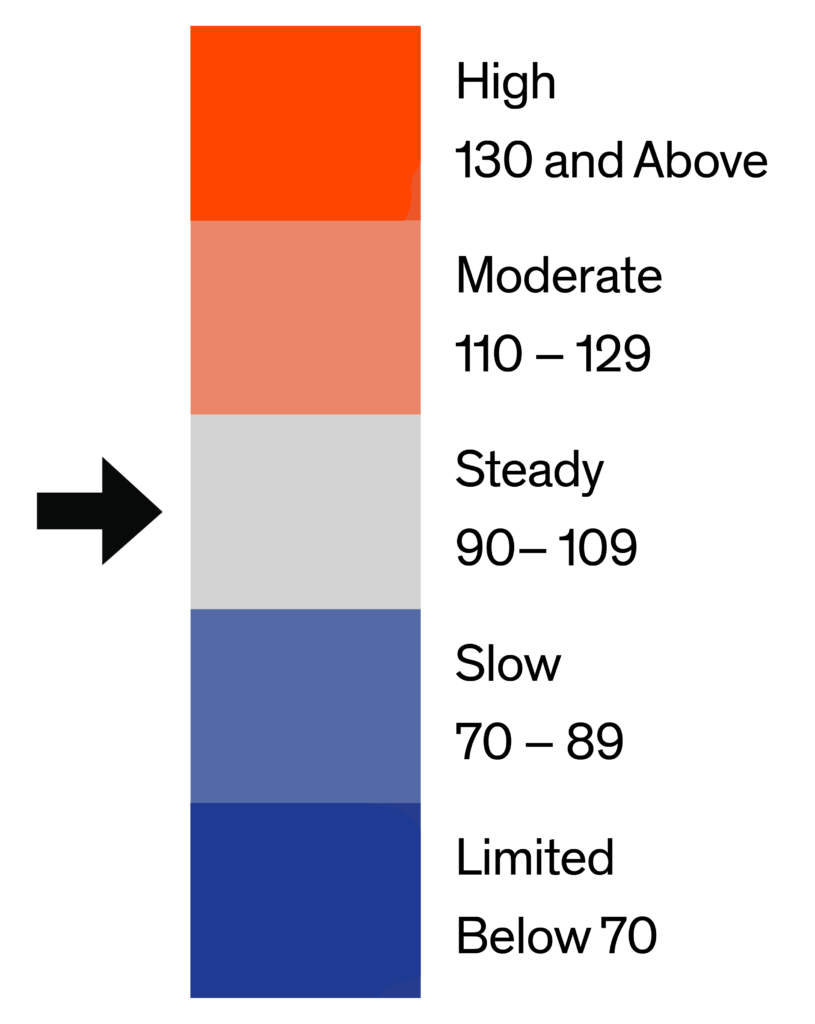
In the Philadelphia market area, roughly one-in-ten ZIP codes recorded a High level of buyer demand in January along with a similar number in the Moderate category. These areas were scattered throughout the market area along with the one-in-five ZIP codes with Steady demand. More than half of the ZIP codes recorded Slow or Limited demand in January many of which were concentrated in the northwest and New Jersey portions of the market area.
Bright MLS | T3 Home Demand Index
www.homedemandindex.com
Download tile as an image.
Embed this tile on your site.
Philadelphia | February 2021
Demand and Inventory by Home Type
Most types of homes in the Philadelphia market area recorded a Bright MLS | T3 Home Demand Index score in the Steady category. While demand did not decrease among any home types, the range of increases over the month was mixed. There was no change in the Index for lower-priced single-family homes while higher-priced single-family and higher-priced condos each recorded an increase in buyer demand of more than 25 percent. Except for higher-priced condos, a small segment of the market, the months supply was at 2.1 or less.
Bright MLS | T3 Home Demand Index
www.homedemandindex.com
Download tile as an image.
Philadelphia | February 2021
Single Family Home Below $195k
Buyer demand for lower-priced single-family homes was unchanged in January and remained at a Limited level. This segment has recorded weak buyer demand for several months, reflecting the exposure of would-be buyers at this price point to the soft economy and job cuts in several hard-hit industries. Despite this weakness, the months supply of homes for sale has been low for several months and in January was just 1.3 as homes continued to be snapped up.
Monthly Statistics for Single Family Home Below $195k
Home Demand Index
50
(Limited)
Home Demand Index from prior month
50
Home Demand Index from prior year
97
Months of inventory
1.3
Average daily inventory last month
819
Inventory sold last month
607
Bright MLS | T3 Home Demand Index
www.homedemandindex.com
Download tile as an image.
Philadelphia | February 2021
Single Family Home $195k - $485k
Demand for mid-priced single-family homes in the Philadelphia market area was Slow in January. The Index, with a reading of 87, rose by 12 percent over the month, but was slightly below the level of one year earlier. There was just a one-month supply of homes for sale in January, little changed from the previous month.
Monthly Statistics for Single Family Home $195k - $485k
Home Demand Index
87
(Slow)
Home Demand Index from prior month
78
Home Demand Index from prior year
91
Months of Inventory
1
Average daily inventory last month
2,334
Inventory sold last month
2,295
Bright MLS | T3 Home Demand Index
www.homedemandindex.com
Download tile as an image.
Philadelphia | February 2021
Single Family Home Above $485k
The Bright MLS |T3 Home Demand Index for single-family homes priced above $485,000 rose 29 percent in January to a reading of Steady. The Index was 16 percent higher than one year earlier suggesting this segment is poised to begin 2021 in a stronger position than last year. The months supply of homes available for sale was 2.1, a small increase from the previous month.
Monthly Statistics for Single Family Home Above $485k
Home Demand Index
103
(Steady)
Home Demand Index from prior month
80
Home Demand Index from prior year
89
Months of Inventory
2.1
Average daily inventory last month
1,447
Inventory sold last month
690
Bright MLS | T3 Home Demand Index
www.homedemandindex.com
Download tile as an image.
Philadelphia | February 2021
Condo Below $360k
Buyer interest in condos priced below $360,000 was Steady in January, rising by 14 percent over the month. The months supply, at 1.6, fell compared to the previous month, suggesting that buyers in this segment will see little relief when searching for condos, while sellers will find no shortage of buyers.
Monthly Statistics for Condo Below $360k
Home Demand Index
109
(Steady)
Home Demand Index from prior month
96
Home Demand Index from prior year
103
Months of Inventory
1.6
Average daily inventory last month
935
Inventory sold last month
594
Bright MLS | T3 Home Demand Index
www.homedemandindex.com
This is Tooltip!
Philadelphia | February 2021
Condo Above $360k
The Bright MLS | T3 Home Demand Index for higher-priced condos rose 33 percent in January to a reading of Steady. Although buyer interest rose, it was somewhat below the level of one year earlier. Buyers searching for condos in this price range found the number of listings on the market more than adequate with a months supply of nine.
Monthly Statistics for Condo Above $360k
Home Demand Index
106
(Steady)
Home Demand Index from prior month
80
Home Demand Index from prior year
112
Months of Inventory
9
Average daily inventory last month
332
Inventory sold last month
37
Bright MLS | T3 Home Demand Index
www.homedemandindex.com
This is Tooltip!
Philadelphia | February 2021
Townhouse/Rowhouse/Twin All prices
Townhouse/ Rowhouse/Twin All prices
Demand for townhouses was up slightly in January to a reading of Steady and at nearly the same level compared with one year earlier. Accounting for more than one-third of sales, interest in townhouses drives a significant portion of the Philadelphia market. Buyers continued to find their search challenging with a 1.8 months supply of homes on the market.
Monthly Statistics for Townhouse/Rowhouse/TwinAll prices
Home Demand Index
98
(Steady)
Home Demand Index from prior month
90
Home Demand Index from prior year
101
Months of Inventory
1.8
Average daily inventory last month
4,790
Inventory sold last month
2,630
Bright MLS | T3 Home Demand Index
www.homedemandindex.com
Note
1. This report is generated with data from the following counties: Berks, PA; Bucks, PA; Burlington, NJ; Camden, NJ; Chester, PA; Delaware, PA; Gloucester, NJ; Kent, DE; Mercer, NJ; Montgomery, PA; New Castle, DE; Philadelphia, PA; Salem, NJ
2. This report is for the February 2021 period with data collected from the previous month.
Released: March 5, 2021
Reference ID: 1102
Philadelphia | February 2021
Home Demand Map (Zip Codes)
In the Philadelphia market area, roughly one-in-ten ZIP codes recorded a High level of buyer demand in January along with a similar number in the Moderate category. These areas were scattered throughout the market area along with the one-in-five ZIP codes with Steady demand. More than half of the ZIP codes recorded Slow or Limited demand in January many of which were concentrated in the northwest and New Jersey portions of the market area.
Bright MLS | T3 Home Demand Index
www.homedemandindex.com
Embed the Timeline
To embed the map on your website, copy and paste the code below. Please note that the ideal dimensions for displaying the map are 1312 pixels wide by 660 pixels high.
Embed the Map
To embed the map on your website, copy and paste the code below. Please note that the ideal dimensions for displaying the map are 1312 pixels wide by 1182 pixels high.
Embed the Housing Type Bar Chart
To embed the map on your website, copy and paste the code below. Please note that the ideal dimensions for displaying the map are 1312 pixels wide by 880 pixels high.