Share report on Facebook!
Share on facebook
Share report on Twitter!
Share on twitter
Share report on LinkedIn!
Share on linkedin
Email a link to this Report!
Share on email
Download tile as an image.

Philadelphia | August 2026

Home Demand Index

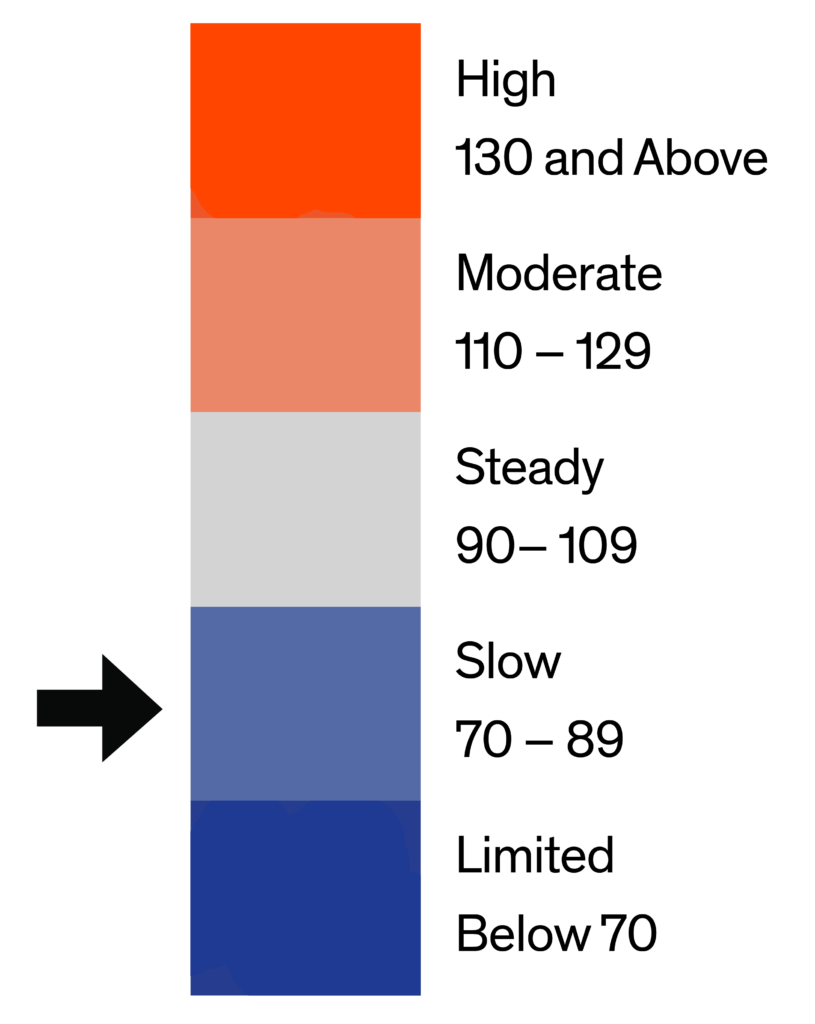
The Home Demand Index (HDI) for the Philadelphia metro area stands at 81 for this report period, down one point from 82 last month and below the 85 recorded during the same period one year ago. The modest month-over-month decline is consistent with the seasonal deceleration typically observed as the market transitions from summer into the late-season selling window, and the four-point year-over-year deficit remains the narrowest among the three metros covered in this report, indicating that Philadelphia continues to track closer to its prior-year baseline than either Baltimore or Washington DC. The most notable development within the tier structure is the entry condo segment’s positive year-over-year reading, up seven points from a year ago to 105, the only tier among the eighteen covered across the three metros this period to register a year-over-year gain.
Demand by home type in Philadelphia this period is defined by a clear split between the condo tiers and single-family, with entry condo the only segment among the six to post a positive year-over-year reading, up three points to 105 and seven points ahead of a year ago, while luxury condo eased seven points to 95, still Steady. All three single-family tiers registered negative year-over-year comparisons: entry single-family held flat at 73, mid single-family eased two points to 77, and luxury single-family eased two points to 71, essentially unchanged from a year ago. Townhouse demand eased one point to 87, rounding out a period where the attached, lower-priced segment is the only genuine source of year-over-year strength in the metro.
Monthly Statistics for August 2026
Home Demand
Index
81
(Slow)
Home Demand Index
from prior month
82
Home Demand Index
from prior year
85
Index change
from prior month
-1.2%
Index change from
same time last year
-4.7%
Bright MLS | T3 Home Demand Index

www.homedemandindex.com

Download tile as an image.
Embed this tile on your site.

Philadelphia | August 2026

Home Demand Index | Historical Year-over-Year Comparison

Over the past 12 months, Philadelphia’s Home Demand Index traced its characteristic seasonal arc, sustaining readings in the high 70s and low 80s through last August and September before declining sharply through the fall and reaching its seasonal floor of 47 in December, followed by a winter recovery that carried through a spring peak of 89 in April. The index then eased to 80 in May, held at 82 in June, and now registers 81, effectively a three-month plateau in the low 80s following the spring peak. At 81, the index trails the 85 posted at this point last year by four points, the narrowest annual gap among the three metros this period and one that reflects the comparatively modest amplitude of Philadelphia’s seasonal cycle.

Home Demand Index

Bright MLS | T3 Home Demand Index

www.homedemandindex.com

Download the top-level Market Areas map as a screenshot.

Embed this tile on your site.

Philadelphia | August 2026

Home Demand Map

Regional demand across the Philadelphia metro this period continues to reflect its established Pennsylvania-versus-New Jersey divide, with Bucks (107), New Castle (98), Kent (98), Montgomery (97), Chester (93), and Delaware (93) forming a tight Steady cluster on the Pennsylvania and Delaware side. Philadelphia County itself sits in Slow territory at 78, reflecting the urban-core affordability constraints that have defined this market throughout the current cycle. Burlington (66), Camden (60), Gloucester (59), and Mercer (59) remain the softest submarkets in the metro, with Mercer and Gloucester tied at the bottom, continuing the cross-river split that has characterized this metro’s geography throughout the current cycle.
Bright MLS | T3 Home Demand Index

www.homedemandindex.com

Download tile as an image.
Embed this tile on your site.

Philadelphia | August 2026

Demand and Inventory by Home Type

Demand by home type in Philadelphia this period is defined by a clear split between the condo tiers and single-family, with entry condo the only segment among the six to post a positive year-over-year reading, up three points to 105 and seven points ahead of a year ago, while luxury condo eased seven points to 95, still Steady. All three single-family tiers registered negative year-over-year comparisons: entry single-family held flat at 73, mid single-family eased two points to 77, and luxury single-family eased two points to 71, essentially unchanged from a year ago. Townhouse demand eased one point to 87, rounding out a period where the attached, lower-priced segment is the only genuine source of year-over-year strength in the metro.
Bright MLS | T3 Home Demand Index

www.homedemandindex.com

Download tile as an image.

Philadelphia | August 2026

Single Family Home Below $370k

The index for entry-level single-family homes in Philadelphia stands at 73 this report period, flat with last month’s 73 and below the 86 recorded one year ago. The absence of month-over-month movement, combined with a thirteen-point year-over-year shortfall, indicates that below-$370,000 buyer demand in this metro remains constrained by the same affordability pressures that have characterized this tier throughout the current cycle. At 2.2 months of inventory across 1,334 active listings and 596 monthly sales, supply conditions remain tight enough that the constrained reading reflects qualification barriers rather than a surplus of accessible inventory.
Monthly Statistics for Single Family Home Below $370k
Home Demand
Index
73
(Slow)
Home Demand Index
from prior month
73
Home Demand Index
from prior year
86
Months of
inventory
2.2
Average daily inventory last month
1,334
Inventory sold
last month
596
Bright MLS | T3 Home Demand Index

www.homedemandindex.com

Download tile as an image.

Philadelphia | August 2026

Single Family Home $370k - $815k

Mid-range single-family homes in the Philadelphia metro registered an index of 77 this report period, down two points from 79 last month and below last year’s reading of 81. The modest sequential decline is consistent with the broader seasonal deceleration observed across the metro this period, and the four-point year-over-year gap remains among the narrower comparisons in this tier’s recent history. At 1.8 months of inventory across 3,729 active listings and 2,059 monthly sales, this segment continues to operate with the tightest supply conditions of any tier in the Philadelphia metro.
Monthly Statistics for Single Family Home $370k - $815k
Home Demand
Index
77
(Slow)
Home Demand Index
from prior month
79
Home Demand Index
from prior year
81
Months of
Inventory
1.8
Average daily inventory last month
3,729
Inventory sold
last month
2,059
Bright MLS | T3 Home Demand Index

www.homedemandindex.com

Download tile as an image.

Philadelphia | August 2026

Single Family Home Above $815k

The index for luxury single-family homes in Philadelphia stands at 71 this report period, down two points from 73 last month and effectively unchanged from last year’s reading of 71. The flat year-over-year comparison is notable in a period where most tiers across the three metros covered in this report are registering meaningful annual shortfalls, suggesting that above-$815,000 buyer demand in this metro has fully normalized against its prior-year baseline. At 2.4 months of inventory across 1,461 active listings and 616 monthly sales, supply conditions in this tier remain moderate relative to the tighter readings observed at lower price points.
Monthly Statistics for Single Family Home Above $815k
Home Demand
Index
71
(Slow)
Home Demand Index
from prior month
73
Home Demand Index
from prior year
71
Months of
Inventory
2.4
Average daily inventory last month
1,461
Inventory sold
last month
616
Bright MLS | T3 Home Demand Index

www.homedemandindex.com

Download tile as an image.

Philadelphia | August 2026

Condo Below $425k

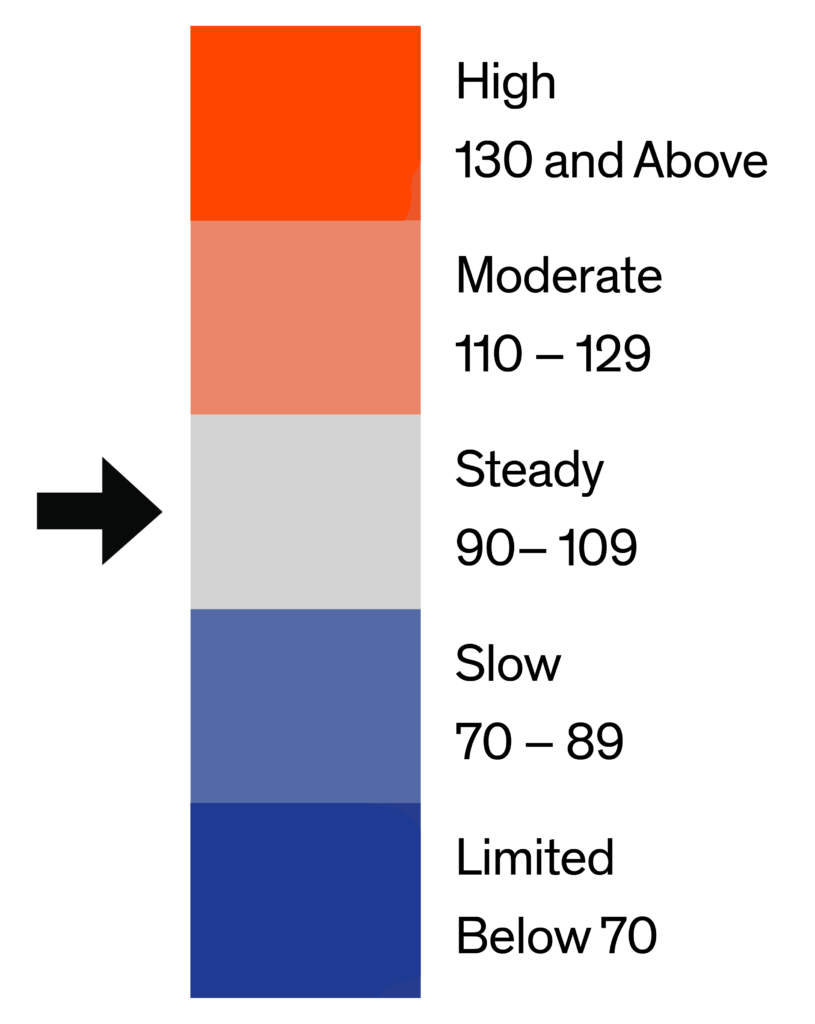
Entry-level condo demand in Philadelphia stands at 105 this report period, up three points from 102 last month and up seven points from last year’s level of 98. This is the only tier among the eighteen covered across the three metros in this report to register a positive year-over-year comparison, consistent with an affordability-substitution dynamic in which buyers priced out of the single-family market continue to direct demand toward this more accessible price point. At 4.2 months of inventory across 1,277 active listings and 307 monthly sales, supply conditions are moderate, providing buyers with meaningful selection even as the index continues to climb.
Monthly Statistics for Condo Below $425k
Home Demand
Index
105
(Steady)
Home Demand Index
from prior month
102
Home Demand Index
from prior year
98
Months of
Inventory
4.2
Average daily inventory last month
1,277
Inventory sold
last month
307
Bright MLS | T3 Home Demand Index

www.homedemandindex.com

This is Tooltip!

Philadelphia | August 2026

Condo Above $425k

Luxury condo demand in Philadelphia registered 95 this report period, down seven points from 102 last month and below last year’s level of 105. The sequential decline keeps this tier in Steady territory, and the ten-point year-over-year shortfall is consistent with the moderation visible across most of the metro’s tiers this period, with the notable exception of entry condo. At 5.3 months of inventory across 294 active listings and 56 monthly sales, this remains a thin segment where transaction-level variation can produce meaningful index movement from month to month.
Monthly Statistics for Condo Above $425k
Home Demand
Index
95
(Steady)
Home Demand Index
from prior month
102
Home Demand Index
from prior year
105
Months of
Inventory
5.3
Average daily inventory last month
294
Inventory sold
last month
56
Bright MLS | T3 Home Demand Index

www.homedemandindex.com

This is Tooltip!

Philadelphia | August 2026

Townhouse/Rowhouse/Twin All prices

Townhouse/
Rowhouse/Twin
All prices

The index for townhouses, rowhouses, and twins in Philadelphia stands at 87 this report period, down one point from 88 last month and below last year’s level of 92. The essentially flat month-over-month reading in this high-volume format is consistent with the broader stability observed across most of the metro’s tiers this period, and the five-point year-over-year shortfall remains among the more modest annual gaps in this report. At 3.7 months of inventory across 7,556 active listings and 2,040 monthly sales, this remains the highest-volume tier in the Philadelphia metro by a wide margin, and its stability this period is a reasonable proxy for the broader market’s underlying condition.
Monthly Statistics for Townhouse/Rowhouse/TwinAll prices
Home Demand
Index
87
(Slow)
Home Demand Index
from prior month
88
Home Demand Index
from prior year
92
Months of
Inventory
3.7
Average daily inventory last month
7,556
Inventory sold
last month
2,040
Bright MLS | T3 Home Demand Index

www.homedemandindex.com

Note

1. This report is generated with data from the following counties:
  • Central Pennsylvania – Adams, PA; Berks, PA; Cumberland, PA; Dauphin, PA; Franklin, PA; Fulton, PA; Lancaster, PA; Lebanon, PA; Perry, PA; Schuylkill, PA; York, PA;
  • Ocean County – Ocean, NJ;
  • Philadelphia Metro – Bucks, PA; Burlington, NJ; Camden, NJ; Chester, PA; Delaware, PA; Gloucester, NJ; Kent, DE; Mercer, NJ; Montgomery, PA; New Castle, DE; Philadelphia, PA;
  • Salem-Cumberland – Cumberland, NJ; Salem, NJ;

2. This report is for the August 2026 period with data collected from the previous month.
Released: August 10, 2026
Reference ID: 2471

Philadelphia | August 2026

Home Demand Map (Zip Codes)

Regional demand across the Philadelphia metro this period continues to reflect its established Pennsylvania-versus-New Jersey divide, with Bucks (107), New Castle (98), Kent (98), Montgomery (97), Chester (93), and Delaware (93) forming a tight Steady cluster on the Pennsylvania and Delaware side. Philadelphia County itself sits in Slow territory at 78, reflecting the urban-core affordability constraints that have defined this market throughout the current cycle. Burlington (66), Camden (60), Gloucester (59), and Mercer (59) remain the softest submarkets in the metro, with Mercer and Gloucester tied at the bottom, continuing the cross-river split that has characterized this metro’s geography throughout the current cycle.
Bright MLS | T3 Home Demand Index

www.homedemandindex.com

Embed the Timeline

To embed the map on your website, copy and paste the code below. Please note that the ideal dimensions for displaying the map are 1312 pixels wide by 660 pixels high.

Embed the Map

To embed the map on your website, copy and paste the code below. Please note that the ideal dimensions for displaying the map are 1312 pixels wide by 1182 pixels high.

Embed the Housing Type Bar Chart

To embed the map on your website, copy and paste the code below. Please note that the ideal dimensions for displaying the map are 1312 pixels wide by 880 pixels high.