August 2021 Report
Philadelphia Metro
Philadelphia | August 2021
Home Demand Index
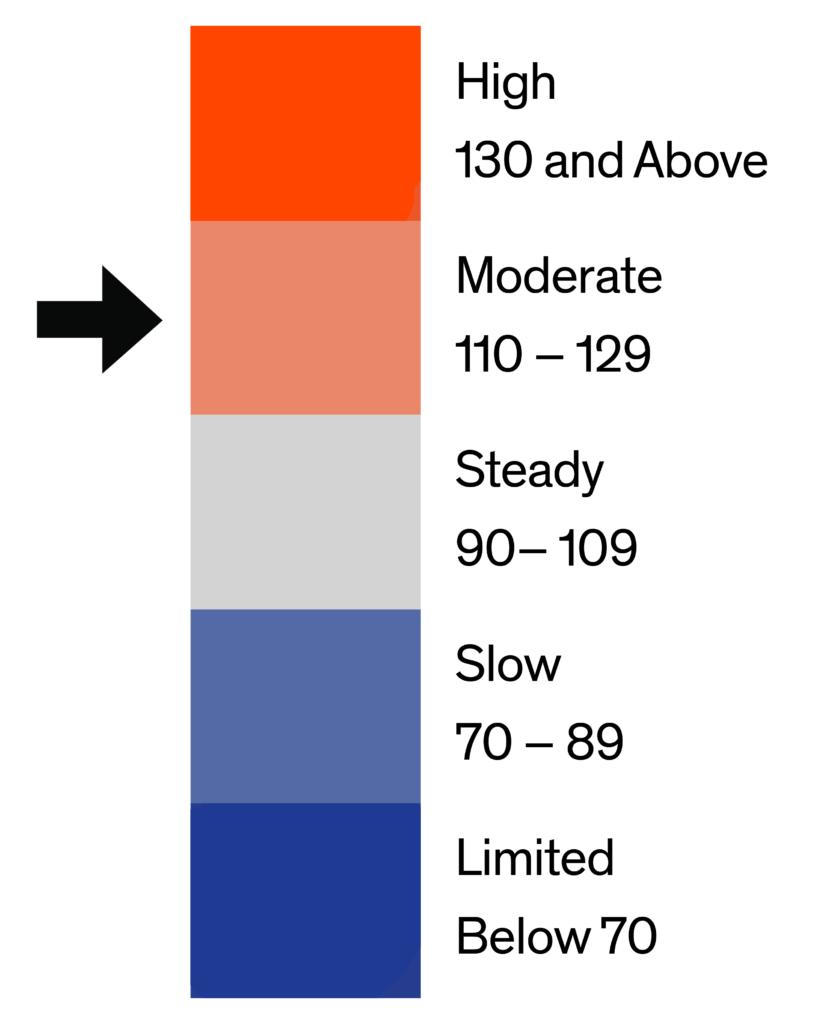
The Bright MLS | T3 Home Demand Index for the Philadelphia Metro area fell nearly 18 percent in July marking the third consecutive decline since the April peak. The Index, at 115, reflected a Moderate level of demand and was 16 percent below the level one year earlier.
Demand among each of the types of homes tracked by the Index fell in July compared with the previous month, reflecting a market-wide decrease in buyer interest. Demand continued to be strongest in the higher-priced single-family segment. The months supply remained extraordinarily lean across all segments of the market, ranging from 1.2 months for mid-priced single-family homes to 4.2 months for higher-priced condos.

Monthly Statistics for August 2021
Home Demand
Index
Index
115
(Moderate)
Home Demand Index
from prior month
from prior month
140
Home Demand Index
from prior year
from prior year
137
Index change
from prior month
from prior month
-17.9%
Index change from
same time last year
same time last year
-16.1%
Bright MLS | T3 Home Demand Index
www.homedemandindex.com
Philadelphia | August 2021
Home Demand Index | Historical Year-over-Year Comparison
Home demand in the Philadelphia market area has softened during the past three months with the largest monthly decline in July. Diminishing affordability as home prices continued to rise due to limited inventory along with a seasonal decline in buyer interest during the summer have contributed to the pullback.
Home Demand Index
Bright MLS | T3 Home Demand Index
www.homedemandindex.com
Philadelphia | August 2021
Home Demand Map
Buyer interest varied widely across the Greater Philadelphia area. The strongest demand was in Ocean County, with an Index reading in the High range. Demand in Central Pennsylvania was Steady, largely due to Slow or Limited demand in five of the 11 counties in the region. In the Philadelphia Metro area, buyer interest was High in the Pennsylvania suburbs and Steady or Slow across the New Jersey portion in the metro area. Across the Greater Philadelphia Region, one-third of ZIP codes were in the High demand range while nearly one-third recorded a Slow or Limited level of buyer interest.
Bright MLS | T3 Home Demand Index
www.homedemandindex.com
Philadelphia | August 2021
Demand and Inventory by Home Type
Demand among each of the types of homes tracked by the Index fell in July compared with the previous month, reflecting a market-wide decrease in buyer interest. Demand continued to be strongest in the higher-priced single-family segment. The months supply remained extraordinarily lean across all segments of the market, ranging from 1.2 months for mid-priced single-family homes to 4.2 months for higher-priced condos.
Bright MLS | T3 Home Demand Index
www.homedemandindex.com
Philadelphia | August 2021
Single Family Home Below $195k
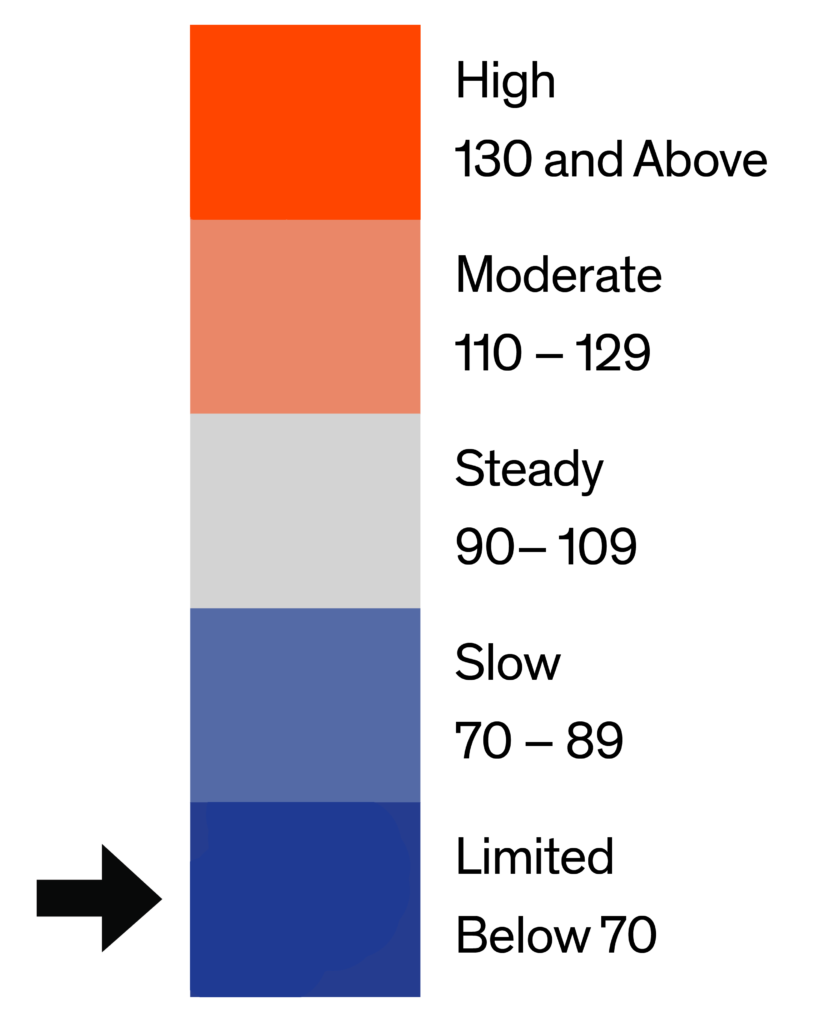
Buyer interest in lower-priced single-family homes decreased by 24 percent in July to an Index reading of just 38. The Index is down by more than half during the past year. Buyers at this price point may still be recovering from pandemic-related income losses while also confronting escalating prices that diminish affordability. The number of homes for sale rose over the month while sales decreased leading to a small increase in months supply. Still, with a months supply of just 1.7, the search for a home will continue to be challenging.

Monthly Statistics for Single Family Home Below $195k
Home Demand
Index
Index
38
(Limited)
Home Demand Index
from prior month
from prior month
50
Home Demand Index
from prior year
from prior year
86
Months of
inventory
inventory
1.7
Average daily inventory last month
565
Inventory sold
last month
last month
341
Bright MLS | T3 Home Demand Index
www.homedemandindex.com
Philadelphia | August 2021
Single Family Home $195k - $485k
The Bright MLS | T3 Home Demand Index for mid-priced single-family homes, at 123 in July, fell by 15 percent to a reading in the Moderate range. Buyer interest in this segment was in the High category for the previous four months, with the latest data reflecting an overall easing of demand in a segment that accounted for 35 percent of total sales. A decline in sales over the month along with a small rise in inventory resulted in a marginal increase in the months supply to 1.2.

Monthly Statistics for Single Family Home $195k - $485k
Home Demand
Index
Index
123
(Moderate)
Home Demand Index
from prior month
from prior month
145
Home Demand Index
from prior year
from prior year
142
Months of
Inventory
Inventory
1.2
Average daily inventory last month
3,385
Inventory sold
last month
last month
2,876
Bright MLS | T3 Home Demand Index
www.homedemandindex.com
Philadelphia | August 2021
Single Family Home Above $485k
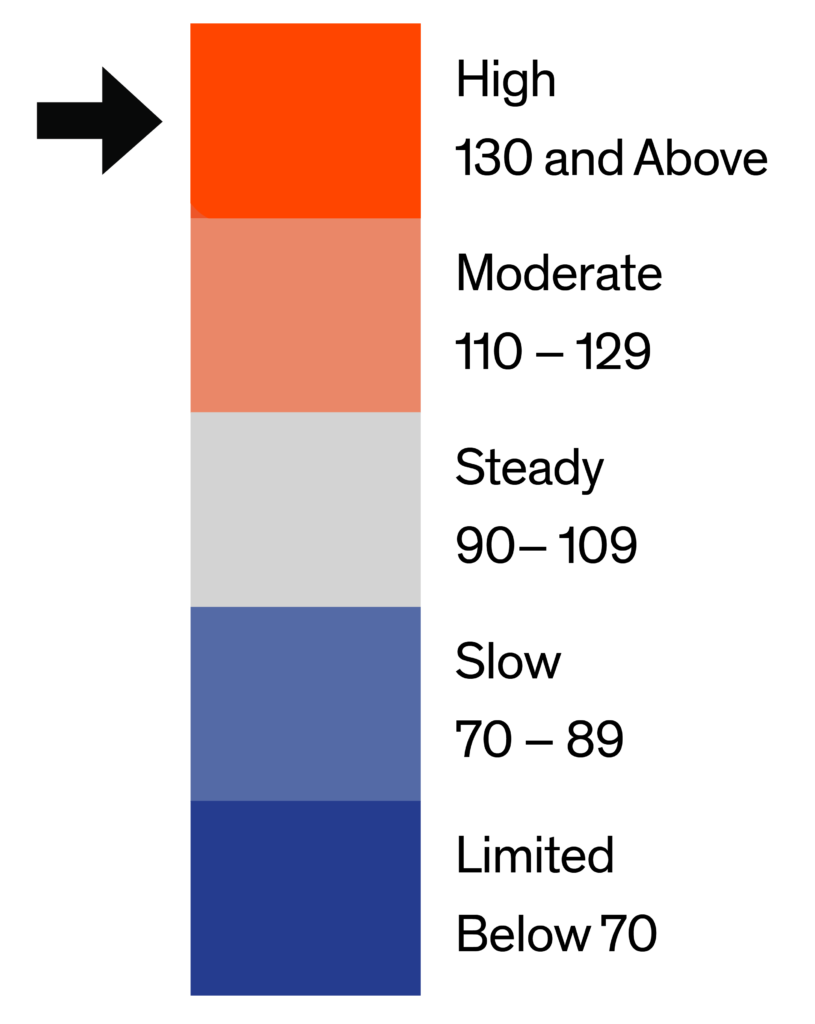
Buyer interest in higher-priced single-family homes took a step back in July with a 24 percent decline in the Bright MLS | T3 Home Demand Index. Despite the decline, demand remained in the High range. This segment of the Philadelphia Metro area has recorded the strongest demand for the past several months, largely due to low mortgage interest rates and a smaller shock to buyer income from the pandemic. The months supply rose marginally in July to 1.6.

Monthly Statistics for Single Family Home Above $485k
Home Demand
Index
Index
180
(High)
Home Demand Index
from prior month
from prior month
238
Home Demand Index
from prior year
from prior year
184
Months of
Inventory
Inventory
1.6
Average daily inventory last month
2,328
Inventory sold
last month
last month
1,433
Bright MLS | T3 Home Demand Index
www.homedemandindex.com
Philadelphia | August 2021
Condo Below $360k
Demand for lower-priced condos fell less than other segments of the Philadelphia market. The Index, at 125 in July, was in the Moderate range, down from a High level of demand in June. Inventory conditions improved slightly with a two-month supply, up from 1.8 months in June.

Monthly Statistics for Condo Below $360k
Home Demand
Index
Index
125
(Moderate)
Home Demand Index
from prior month
from prior month
146
Home Demand Index
from prior year
from prior year
130
Months of
Inventory
Inventory
2
Average daily inventory last month
919
Inventory sold
last month
last month
451
Bright MLS | T3 Home Demand Index
www.homedemandindex.com
Philadelphia | August 2021
Condo Above $360k
The Bright MLS | T3 Home Demand Index for higher-priced condos, although still reflecting a High level of demand, fell to a reading of 131. For the past several months, buyer interest in this segment has been very strong, second only to higher-priced single-family homes. Inventory conditions improved over the month with the months supply rising from 3.1 months to 4.2 months, the highest of any segment in the Philadelphia Metro area.

Monthly Statistics for Condo Above $360k
Home Demand
Index
Index
131
(High)
Home Demand Index
from prior month
from prior month
171
Home Demand Index
from prior year
from prior year
150
Months of
Inventory
Inventory
4.2
Average daily inventory last month
387
Inventory sold
last month
last month
92
Bright MLS | T3 Home Demand Index
www.homedemandindex.com
Philadelphia | August 2021
Townhouse/Rowhouse/Twin All prices
Townhouse/
Rowhouse/Twin
All prices
Buyer interest in townhouses was Moderate in July with an Index reading of 117, down 18 percent compared with the previous month. The months supply rose marginally to 1.8 in July with a slightly stronger rise in inventory only partially offset by the rise in sales. Demand for townhouses has been elevated for several months, with the latest data still reflecting solid demand even if at a modestly lower level.

Monthly Statistics for Townhouse/Rowhouse/TwinAll prices
Home Demand
Index
Index
117
(Moderate)
Home Demand Index
from prior month
from prior month
143
Home Demand Index
from prior year
from prior year
139
Months of
Inventory
Inventory
1.8
Average daily inventory last month
5,730
Inventory sold
last month
last month
3,138
Bright MLS | T3 Home Demand Index
www.homedemandindex.com
Note
1. This report is generated with data from the following counties:
- Central Pennsylvania – Adams, PA; Berks, PA; Cumberland, PA; Dauphin, PA; Franklin, PA; Fulton, PA; Lancaster, PA; Lebanon, PA; Perry, PA; Schuylkill, PA; York, PA;
- Ocean County – Ocean, NJ;
- Philadelphia Metro – Bucks, PA; Burlington, NJ; Camden, NJ; Chester, PA; Delaware, PA; Gloucester, NJ; Kent, DE; Mercer, NJ; Montgomery, PA; New Castle, DE; Philadelphia, PA;
- Salem-Cumberland – Cumberland, NJ; Salem, NJ;
2. This report is for the August 2021 period with data collected from the previous month.
Released: August 3, 2021
Reference ID: 1329
Philadelphia | August 2021
Home Demand Map (Zip Codes)
Buyer interest varied widely across the Greater Philadelphia area. The strongest demand was in Ocean County, with an Index reading in the High range. Demand in Central Pennsylvania was Steady, largely due to Slow or Limited demand in five of the 11 counties in the region. In the Philadelphia Metro area, buyer interest was High in the Pennsylvania suburbs and Steady or Slow across the New Jersey portion in the metro area. Across the Greater Philadelphia Region, one-third of ZIP codes were in the High demand range while nearly one-third recorded a Slow or Limited level of buyer interest.

Bright MLS | T3 Home Demand Index
www.homedemandindex.com