The Bright MLS | T3 Home Demand Index rose by an extraordinary 30 percent in March to a level indicating a High level of buyer interest in homes in the Philadelphia MLS market area. Compared to one year earlier, the Index was 33 percent higher showing that buyer demand is on a trajectory to retrace or exceed the strong performance exhibited last year.
Buyer interest rose for each type of home tracked by the Bright MLS | T3 Home Demand Index in March. The smallest gain was in the lower-priced single-family segment, which has recorded weak demand for several months. Demand rose by one-third in the two largest segments, higher-priced single-family homes and townhouses. Except for lower-priced single-family homes, all segments recorded an Index significantly higher than one year earlier, even though low inventory remained a hurdle for most buyers when searching for a home.
Monthly Statistics for April 2021
Home Demand Index
130
(High)
Home Demand Index from prior month
100
Home Demand Index from prior year
98
Index change from prior month
30%
Index change from same time last year
32.7%
Bright MLS | T3 Home Demand Index
www.homedemandindex.com
Download tile as an image.
Embed this tile on your site.
Philadelphia | April 2021
Home Demand Index | Historical Year-over-Year Comparison
Demand for homes in the Philadelphia market area not only rose in March, but also continued a trend of accelerating growth since the seasonal low in December. Recovery from the depths of the pandemic-induced recession and an improving employment situation has contributed to the rising level of buyer interest. Despite a rise in mortgage interest rates in recent weeks, buyer demand is approaching the elevated level experienced last summer following the disruptions to the spring homebuying market.
Home Demand Index
Bright MLS | T3 Home Demand Index
www.homedemandindex.com
Download the top-level Market Areas map as a screenshot.
Embed this tile on your site.
Philadelphia | April 2021
Home Demand Map
Buyer demand for homes was High in more than 40 percent of ZIP codes in the Philadelphia market area in March, more than double the number in February. Among the 20 percent of communities with Slow or Limited demand – about half as many as the month before – most were in the New Jersey portion of the market area.
Bright MLS | T3 Home Demand Index
www.homedemandindex.com
Download tile as an image.
Embed this tile on your site.
Philadelphia | April 2021
Demand and Inventory by Home Type
Buyer interest rose for each type of home tracked by the Bright MLS | T3 Home Demand Index in March. The smallest gain was in the lower-priced single-family segment, which has recorded weak demand for several months. Demand rose by one-third in the two largest segments, higher-priced single-family homes and townhouses. Except for lower-priced single-family homes, all segments recorded an Index significantly higher than one year earlier, even though low inventory remained a hurdle for most buyers when searching for a home.
Bright MLS | T3 Home Demand Index
www.homedemandindex.com
Download tile as an image.
Philadelphia | April 2021
Single Family Home Below $195k
Demand for lower-priced single-family homes has been mostly flat during the past several months. In March, the Index rose a modest nine percent but remained in the Limited category. Compared with one year earlier, buyer interest was down by more than 30 percent due, in part, to rising home prices that have squeezed affordability and the impact of the economic slowdown on would-be home buyers at this price point. The months supply of homes, at 1.4, was down from 1.6 in February.
Monthly Statistics for Single Family Home Below $195k
Home Demand Index
59
(Limited)
Home Demand Index from prior month
54
Home Demand Index from prior year
85
Months of inventory
1.4
Average daily inventory last month
687
Inventory sold last month
502
Bright MLS | T3 Home Demand Index
www.homedemandindex.com
Download tile as an image.
Philadelphia | April 2021
Single Family Home $195k - $485k
The Index for mid-priced single-family homes, which accounted for about one-third of all sales, rose by one-third over the month to 132, signifying High buyer interest. Demand rose for the third consecutive month and was 33 percent greater than one year earlier. There was just a one-month supply of homes available for sale in March, down marginally from the previous month as well as the lowest among all types of Philadelphia area homes tracked by the Index.
Monthly Statistics for Single Family Home $195k - $485k
Home Demand Index
132
(High)
Home Demand Index from prior month
99
Home Demand Index from prior year
99
Months of Inventory
1
Average daily inventory last month
2,218
Inventory sold last month
2,327
Bright MLS | T3 Home Demand Index
www.homedemandindex.com
Download tile as an image.
Philadelphia | April 2021
Single Family Home Above $485k
The Bright MLS | T3 Home Demand Index for higher-priced single-family homes not only remained in the High category but rose by 46 percent in March alone. With an Index reading of 197, this segment recorded the highest level of buyer interest among all types of homes in the Philadelphia market area. Even with a low 2.2 months supply, buyers still experienced more favorable inventory conditions than searchers in several other segments of the market.
Monthly Statistics for Single Family Home Above $485k
Home Demand Index
197
(High)
Home Demand Index from prior month
135
Home Demand Index from prior year
111
Months of Inventory
2.2
Average daily inventory last month
1,595
Inventory sold last month
717
Bright MLS | T3 Home Demand Index
www.homedemandindex.com
Download tile as an image.
Philadelphia | April 2021
Condo Below $360k
Buyer interest in lower-priced condos was High in March with an Index reading of 140. Demand rose 21 percent over the month and was nearly 50 percent higher than last year. The inventory of condos available for sale was lean at 2.2 months, but still more favorable than similarly priced single-family homes.
Monthly Statistics for Condo Below $360k
Home Demand Index
140
(High)
Home Demand Index from prior month
116
Home Demand Index from prior year
95
Months of Inventory
2.2
Average daily inventory last month
898
Inventory sold last month
400
Bright MLS | T3 Home Demand Index
www.homedemandindex.com
This is Tooltip!
Philadelphia | April 2021
Condo Above $360k
The March reading of the Index for higher-priced condos, at 193, was moderately higher compared with the previous month but nearly 70 percent higher than one year earlier. The inventory of condos for sale was adequate given the typically small number of sales each month. Still, the months supply fell to 5.1 from 11.2 in February.
Monthly Statistics for Condo Above $360k
Home Demand Index
193
(High)
Home Demand Index from prior month
161
Home Demand Index from prior year
115
Months of Inventory
5.1
Average daily inventory last month
390
Inventory sold last month
76
Bright MLS | T3 Home Demand Index
www.homedemandindex.com
This is Tooltip!
Philadelphia | April 2021
Townhouse/Rowhouse/Twin All prices
Townhouse/ Rowhouse/Twin All prices
The Bright MLS | T3 Home Demand Index for the townhouse segment rose 30 percent to a reading reflecting a High level of buyer interest in March. Like most other types of homes tracked by the Index, the demand for townhouses in the Philadelphia market area was significantly higher than one year earlier. The months supply decreased to 1.6 from two the previous month.
Monthly Statistics for Townhouse/Rowhouse/TwinAll prices
Home Demand Index
140
(High)
Home Demand Index from prior month
108
Home Demand Index from prior year
100
Months of Inventory
1.6
Average daily inventory last month
4,521
Inventory sold last month
2,750
Bright MLS | T3 Home Demand Index
www.homedemandindex.com
Note
1. This report is generated with data from the following counties: Berks, PA; Bucks, PA; Burlington, NJ; Camden, NJ; Chester, PA; Delaware, PA; Gloucester, NJ; Kent, DE; Mercer, NJ; Montgomery, PA; New Castle, DE; Philadelphia, PA; Salem, NJ
2. This report is for the April 2021 period with data collected from the previous month.
Released: April 12, 2021
Reference ID: 1160
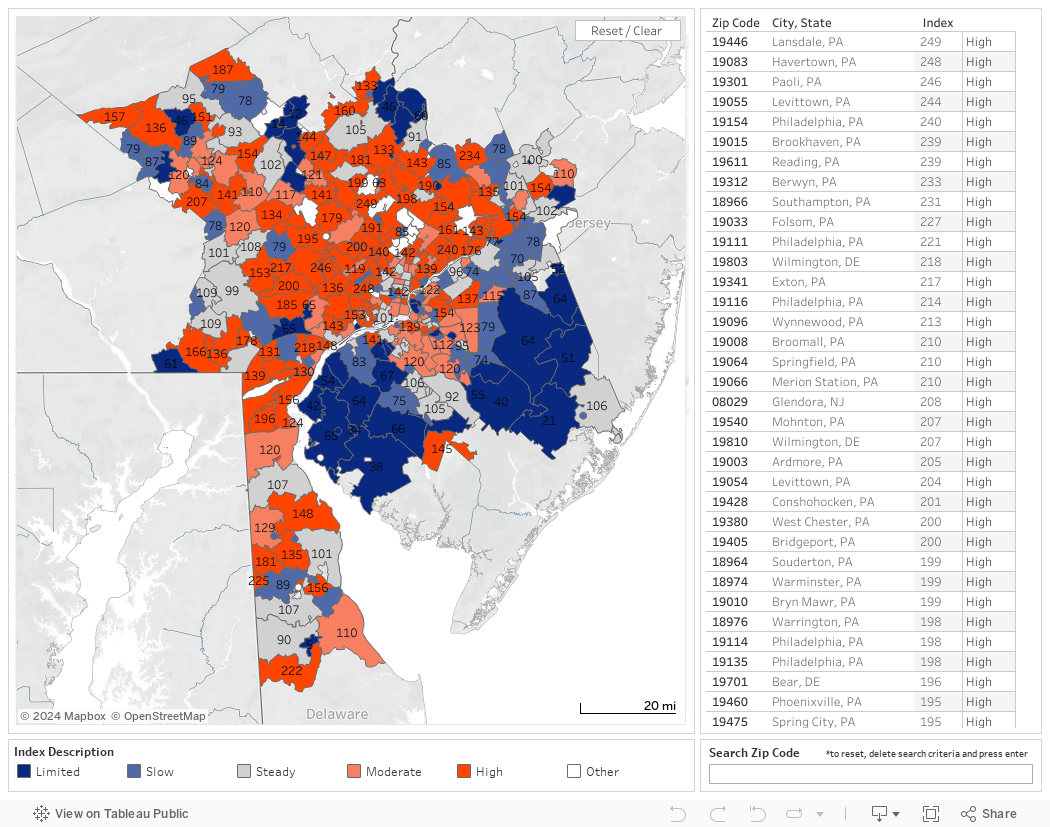
Philadelphia | April 2021
Home Demand Map (Zip Codes)
Buyer demand for homes was High in more than 40 percent of ZIP codes in the Philadelphia market area in March, more than double the number in February. Among the 20 percent of communities with Slow or Limited demand – about half as many as the month before – most were in the New Jersey portion of the market area.
Bright MLS | T3 Home Demand Index
www.homedemandindex.com
Embed the Timeline
To embed the map on your website, copy and paste the code below. Please note that the ideal dimensions for displaying the map are 1312 pixels wide by 660 pixels high.
Embed the Map
To embed the map on your website, copy and paste the code below. Please note that the ideal dimensions for displaying the map are 1312 pixels wide by 1182 pixels high.
Embed the Housing Type Bar Chart
To embed the map on your website, copy and paste the code below. Please note that the ideal dimensions for displaying the map are 1312 pixels wide by 880 pixels high.