Share report on Facebook!
Share on facebook
Share report on Twitter!
Share on twitter
Share report on LinkedIn!
Share on linkedin
Email a link to this Report!
Share on email
Download tile as an image.

Baltimore | October 2022

Home Demand Index

The Bright MLS | T3 Home Demand Index for the Baltimore Metro area fell 5.6 percent in September. Buyer interest remained in the Steady range. Compared with one year earlier the Index was 16.5 percent lower.
Among the types of homes tracked by the Bright MLS | T3 Home Demand Index, buyer interest was greatest for higher-priced single-family homes and higher-priced condos, each remaining in the High demand range. Demand softened for each segment of the market in September with the largest month-to-month declines in higher-priced single-family homes, and each of the condo segments. The months supply rose for all segments, other than condos, reflecting a lower level of sales and little change in the number of listings on the market. The months supply ranged from 2.2 months for townhouses to just 1.2 months for lower-priced condos.
Monthly Statistics for October 2022
Home Demand
Index
101
(Steady)
Home Demand Index
from prior month
107
Home Demand Index
from prior year
121
Index change
from prior month
-5.6%
Index change from
same time last year
-16.5%
Bright MLS | T3 Home Demand Index

www.homedemandindex.com

Download tile as an image.
Embed this tile on your site.

Baltimore | October 2022

Home Demand Index | Historical Year-over-Year Comparison

Demand for homes has fallen for two consecutive months, likely in reaction to rising mortgage rates and growing uneasiness about the state of the economy. Buyer interest in Baltimore Metro area homes has been well-below the pace set one year earlier with the most significant difference over the spring buying season.

Home Demand Index

Bright MLS | T3 Home Demand Index

www.homedemandindex.com

Download the top-level Market Areas map as a screenshot.

Embed this tile on your site.

Baltimore | October 2022

Home Demand Map

In the Baltimore Metro area, buyer interest in Howard County homes remained in the High range. Elsewhere, the level of activity was Moderate in Anne Arundel and Baltimore counties and Steady in Carroll and Harford counties. Buyer interest in Baltimore City homes remained in the Slow category. Demand was Moderate in the DelMar Coastal area and Steady in the Maryland Eastern Shore area. Across the Greater Baltimore area demand in 41 percent of ZIP codes was in the High or Moderate range unchanged from August. Nearly as many ZIP codes, 38 percent, recorded Limited or Slow demand in September.
Bright MLS | T3 Home Demand Index

www.homedemandindex.com

Download tile as an image.
Embed this tile on your site.

Baltimore | October 2022

Demand and Inventory by Home Type

Among the types of homes tracked by the Bright MLS | T3 Home Demand Index, buyer interest was greatest for higher-priced single-family homes and higher-priced condos, each remaining in the High demand range. Demand softened for each segment of the market in September with the largest month-to-month declines in higher-priced single-family homes, and each of the condo segments. The months supply rose for all segments, other than condos, reflecting a lower level of sales and little change in the number of listings on the market. The months supply ranged from 2.2 months for townhouses to just 1.2 months for lower-priced condos.
Bright MLS | T3 Home Demand Index

www.homedemandindex.com

Download tile as an image.

Baltimore | October 2022

Single Family Home Below $250k

Buyer interest in lower-priced single-family homes changed little over the month. The Index, at 36, continued to reflect Limited demand for homes at lower price points. There was a two-month supply of homes on the market, an increase from the 1.4 months supply in August.
Monthly Statistics for Single Family Home Below $250k
Home Demand
Index
36
(Limited)
Home Demand Index
from prior month
37
Home Demand Index
from prior year
51
Months of
inventory
2
Average daily inventory last month
242
Inventory sold
last month
119
Bright MLS | T3 Home Demand Index

www.homedemandindex.com

Download tile as an image.

Baltimore | October 2022

Single Family Home $250k - $590k

Demand for mid-priced single-family homes decreased in September. The Index, at 102, reflected a Steady pace of demand. Compared with one year earlier, the Index was 21 percent lower, suggesting that buyers in this segment have been increasingly hampered by higher mortgage rates and limited inventory during the past year. The months supply, although up slightly from August, was at just 1.4 in September.
Monthly Statistics for Single Family Home $250k - $590k
Home Demand
Index
102
(Steady)
Home Demand Index
from prior month
111
Home Demand Index
from prior year
129
Months of
Inventory
1.4
Average daily inventory last month
1,265
Inventory sold
last month
893
Bright MLS | T3 Home Demand Index

www.homedemandindex.com

Download tile as an image.

Baltimore | October 2022

Single Family Home Above $590k

The Bright MLS | T3 Home Demand Index for higher-priced single-family homes decreased to 197 but remained in the High demand category. The Index was in the High range throughout the spring and summer months and has been one of the strongest segments of the Baltimore Metro area market. The months supply rose slightly in September but remained relatively low at just 1.8 months.
Monthly Statistics for Single Family Home Above $590k
Home Demand
Index
197
(High)
Home Demand Index
from prior month
218
Home Demand Index
from prior year
217
Months of
Inventory
1.8
Average daily inventory last month
781
Inventory sold
last month
428
Bright MLS | T3 Home Demand Index

www.homedemandindex.com

Download tile as an image.

Baltimore | October 2022

Condo Below $310k

Buyer interest in lower-priced condos fell in September. The Index, at 80, was down19 percent over the month and nearly one-third lower than a year earlier. Inventory conditions remained very lean. The months supply at just 1.2 month was down slightly from August.
Monthly Statistics for Condo Below $310k
Home Demand
Index
80
(Slow)
Home Demand Index
from prior month
99
Home Demand Index
from prior year
117
Months of
Inventory
1.2
Average daily inventory last month
199
Inventory sold
last month
172
Bright MLS | T3 Home Demand Index

www.homedemandindex.com

This is Tooltip!

Baltimore | October 2022

Condo Above $310k

Demand for higher-priced condos remained resilient. The Index, at 225, was down over the month but remained well above the threshold indicating a High level of buyer interest. The months supply decreased to 2.1 in September from 2.3 months in August. Moreover, condo buyers at this price point may find relatively few options given that this segment makes up only about three percent of inventory on the market.
Monthly Statistics for Condo Above $310k
Home Demand
Index
225
(High)
Home Demand Index
from prior month
252
Home Demand Index
from prior year
255
Months of
Inventory
2.1
Average daily inventory last month
133
Inventory sold
last month
62
Bright MLS | T3 Home Demand Index

www.homedemandindex.com

This is Tooltip!

Baltimore | October 2022

Townhouse/Rowhouse/Twin All prices

Townhouse/
Rowhouse/Twin
All prices

The Bright MLS | T3 Home Demand Index for the townhouse segment, at 111, fell slightly in September but continued to reflect a Moderate pace of demand. The Index was 16 percent lower than one year earlier. Compared with other segments of the Baltimore Metro area market, the months supply was relatively more favorable for buyers with 2.2 months of inventory in September, an increase from 1.8 months in August.
Monthly Statistics for Townhouse/Rowhouse/TwinAll prices
Home Demand
Index
111
(Moderate)
Home Demand Index
from prior month
115
Home Demand Index
from prior year
132
Months of
Inventory
2.2
Average daily inventory last month
2,469
Inventory sold
last month
1,124
Bright MLS | T3 Home Demand Index

www.homedemandindex.com

Note

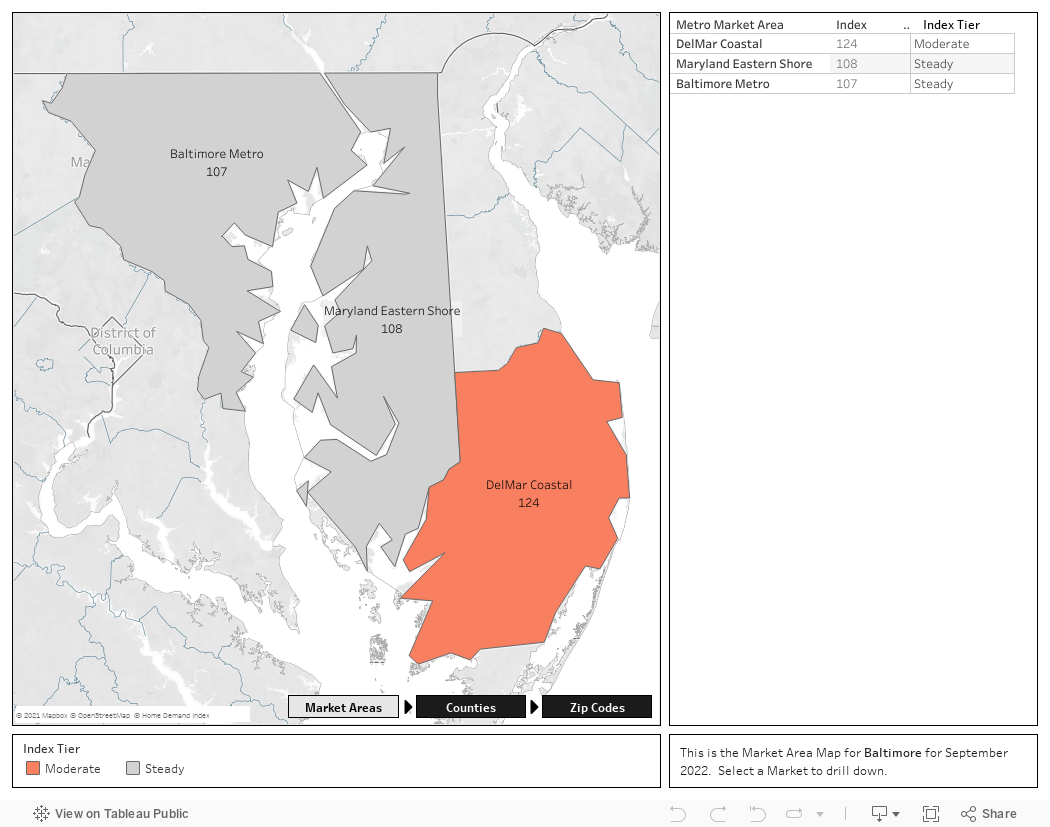
1. This report is generated with data from the following counties:
  • Baltimore Metro – Anne Arundel, MD; Baltimore City, MD; Baltimore, MD; Carroll, MD; Harford, MD; Howard, MD;
  • DelMar Coastal – Somerset, MD; Sussex, DE; Wicomico, MD; Worcester, MD;
  • Maryland Eastern Shore – Caroline, MD; Cecil, MD; Dorchester, MD; Kent, MD; Queen Annes, MD; Talbot, MD;
2. This report is for the October 2022 period with data collected from the previous month.
Released: October 11, 2022
Reference ID: 1694

Baltimore | October 2022

Home Demand Map (Zip Codes)

In the Baltimore Metro area, buyer interest in Howard County homes remained in the High range. Elsewhere, the level of activity was Moderate in Anne Arundel and Baltimore counties and Steady in Carroll and Harford counties. Buyer interest in Baltimore City homes remained in the Slow category. Demand was Moderate in the DelMar Coastal area and Steady in the Maryland Eastern Shore area. Across the Greater Baltimore area demand in 41 percent of ZIP codes was in the High or Moderate range unchanged from August. Nearly as many ZIP codes, 38 percent, recorded Limited or Slow demand in September.
Bright MLS | T3 Home Demand Index

www.homedemandindex.com

Embed the Timeline

To embed the map on your website, copy and paste the code below. Please note that the ideal dimensions for displaying the map are 1312 pixels wide by 660 pixels high.

Embed the Map

To embed the map on your website, copy and paste the code below. Please note that the ideal dimensions for displaying the map are 1312 pixels wide by 1182 pixels high.

Embed the Housing Type Bar Chart

To embed the map on your website, copy and paste the code below. Please note that the ideal dimensions for displaying the map are 1312 pixels wide by 880 pixels high.