May 2023 Report
Baltimore Metro
Baltimore | May 2023
Home Demand Index
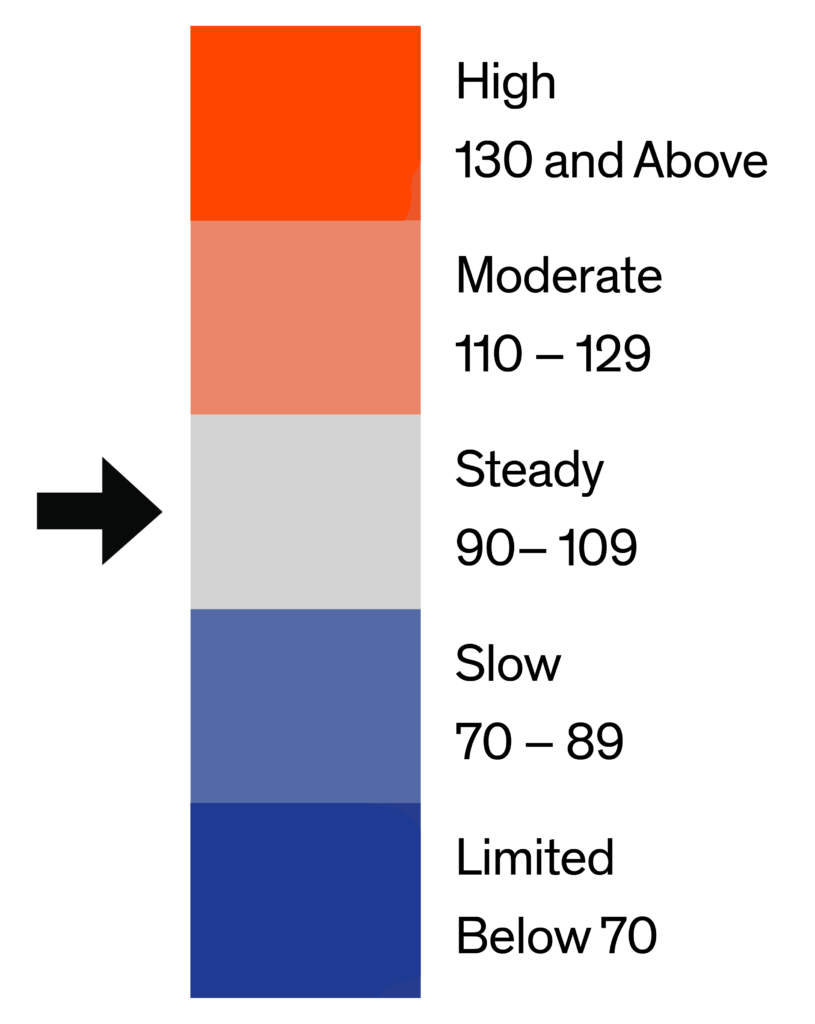
The Bright MLS | T3 Home Demand Index for the Baltimore Metro area rose in April with the Index moving from Slow to Steady over the month. The Index, at 93, was 5.7 percent higher compare with March but remained well below the level one year earlier.
Buyer interest rose for all types of Baltimore Metro area homes over the month. Luxury condos continued to attract a High level of demand. Buyer interest was Slow for entry- and mid-market single-family homes and Steady or Moderate for other types of homes. The months supply of luxury single-family homes was lower in April, moving from 2.3 to two months largely due to an uptick in sales and was flat or only slightly higher for other types of homes. The months supply ranged from 1.2 months for mid-market single-family homes to 3.2 months for luxury condos.

Monthly Statistics for May 2023
Home Demand
Index
Index
93
(Steady)
Home Demand Index
from prior month
from prior month
88
Home Demand Index
from prior year
from prior year
128
Index change
from prior month
from prior month
5.7%
Index change from
same time last year
same time last year
-27.3%
Bright MLS | T3 Home Demand Index
www.homedemandindex.com
Baltimore | May 2023
Home Demand Index | Historical Year-over-Year Comparison
Demand for homes through the first four months of this year has risen at a slower pace than last year. The April Index was 27.3 percent lower than a year ago when demand was in the Moderate range. While there are several factors that have contributed to the reduced level of buyer demand, higher mortgage rates and lean inventory have limited buyer activity.
Home Demand Index
Bright MLS | T3 Home Demand Index
www.homedemandindex.com
Baltimore | May 2023
Home Demand Map
Across the Baltimore Metro area, demand for homes strengthened in Howard County, rising from Moderate to High in April. The Index remained in the Steady range in Baltimore County and was in the Slow category across the rest of the metro area. Demand was Steady in the DelMar Coastal and Maryland Eastern Shore market areas. Buyer interest in homes was High in just over one-fifth of ZIP codes, an increase from 15 percent in March. At the same time, the Index in roughly half of ZIP codes was in the Slow or Limited range, a decrease from 59 percent the previous month.
Bright MLS | T3 Home Demand Index
www.homedemandindex.com
Baltimore | May 2023
Demand and Inventory by Home Type
Buyer interest rose for all types of Baltimore Metro area homes over the month. Luxury condos continued to attract a High level of demand. Buyer interest was Slow for entry- and mid-market single-family homes and Steady or Moderate for other types of homes. The months supply of luxury single-family homes was lower in April, moving from 2.3 to two months largely due to an uptick in sales and was flat or only slightly higher for other types of homes. The months supply ranged from 1.2 months for mid-market single-family homes to 3.2 months for luxury condos.
Bright MLS | T3 Home Demand Index
www.homedemandindex.com
Baltimore | May 2023
Single Family Home Below $327k
Buyer interest rose for all types of Baltimore Metro area homes over the month. Luxury condos continued to attract a High level of demand. Buyer interest was Slow for entry- and mid-market single-family homes and Steady or Moderate for other types of homes. The months supply of luxury single-family homes was lower in April, moving from 2.3 to two months largely due to an uptick in sales and was flat or only slightly higher for other types of homes. The months supply ranged from 1.2 months for mid-market single-family homes to 3.2 months for luxury condos.

Monthly Statistics for Single Family Home Below $327k
Home Demand
Index
Index
76
(Slow)
Home Demand Index
from prior month
from prior month
74
Home Demand Index
from prior year
from prior year
94
Months of
inventory
inventory
1.3
Average daily inventory last month
357
Inventory sold
last month
last month
282
Bright MLS | T3 Home Demand Index
www.homedemandindex.com
Baltimore | May 2023
Single Family Home $327k - $750k
The Bright MLS | T3 Home Demand Index for mid-market single-family homes, at 89, was up marginally from the month before and reflected a Slow pace of demand. The Index was 32 percent lower than a year earlier, consistent with a pattern of softer demand among all types of Baltimore Metro area homes compared with last year. The inventory of homes on the market remained very low, with just a 1.2 months supply in April.

Monthly Statistics for Single Family Home $327k - $750k
Home Demand
Index
Index
89
(Slow)
Home Demand Index
from prior month
from prior month
83
Home Demand Index
from prior year
from prior year
130
Months of
Inventory
Inventory
1.2
Average daily inventory last month
797
Inventory sold
last month
last month
658
Bright MLS | T3 Home Demand Index
www.homedemandindex.com
Baltimore | May 2023
Single Family Home Above $750k
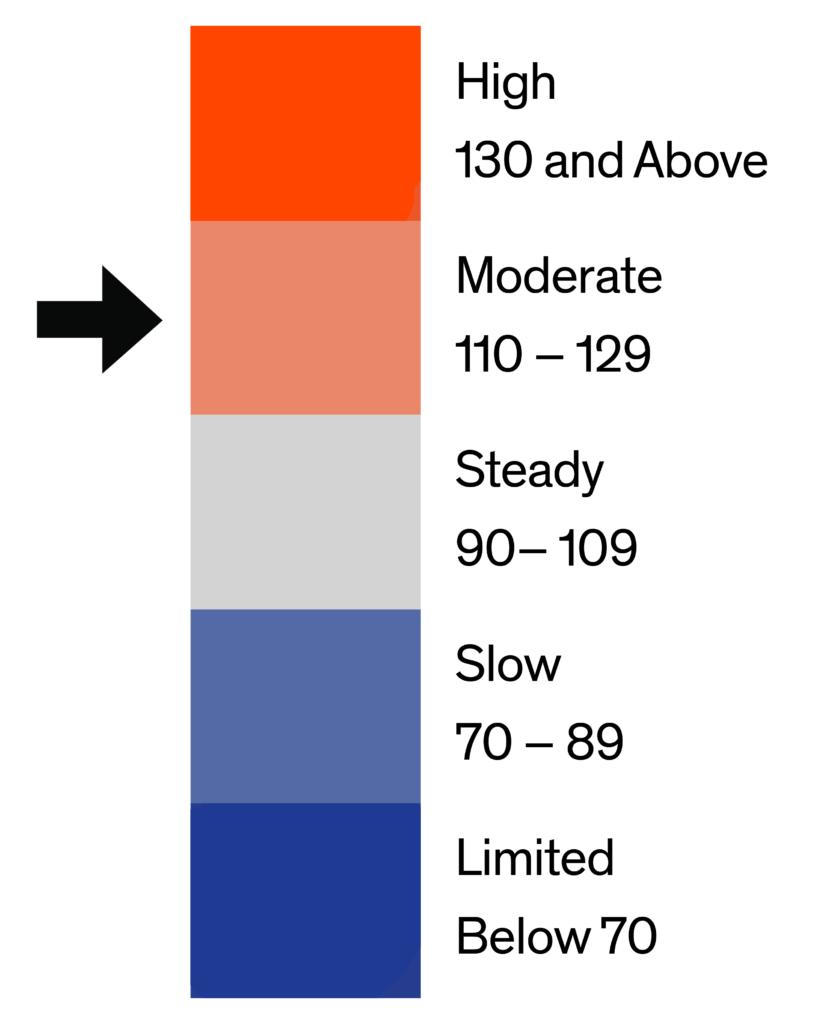
Demand for luxury single-family homes increased in April, moving from Steady to Moderate buyer interest over the month. The Index, at 112, rose 11 percent but was still 30 percent lower than the year earlier High level of demand. Like other single-family segments, the months supply continued to be very low, falling to two months from 2.3 months in March.

Monthly Statistics for Single Family Home Above $750k
Home Demand
Index
Index
112
(Moderate)
Home Demand Index
from prior month
from prior month
101
Home Demand Index
from prior year
from prior year
159
Months of
Inventory
Inventory
2
Average daily inventory last month
397
Inventory sold
last month
last month
202
Bright MLS | T3 Home Demand Index
www.homedemandindex.com
Baltimore | May 2023
Condo Below $375k
Buyer interest in entry-level condos was virtually unchanged in April and continued to reflect a Steady pace of demand. The Index, at 103, was roughly one-fifth lower than a year earlier. There was a 1.3 months supply of homes for sale, the same as the previous month.

Monthly Statistics for Condo Below $375k
Home Demand
Index
Index
103
(Steady)
Home Demand Index
from prior month
from prior month
102
Home Demand Index
from prior year
from prior year
126
Months of
Inventory
Inventory
1.3
Average daily inventory last month
209
Inventory sold
last month
last month
167
Bright MLS | T3 Home Demand Index
www.homedemandindex.com
Baltimore | May 2023
Condo Above $375k
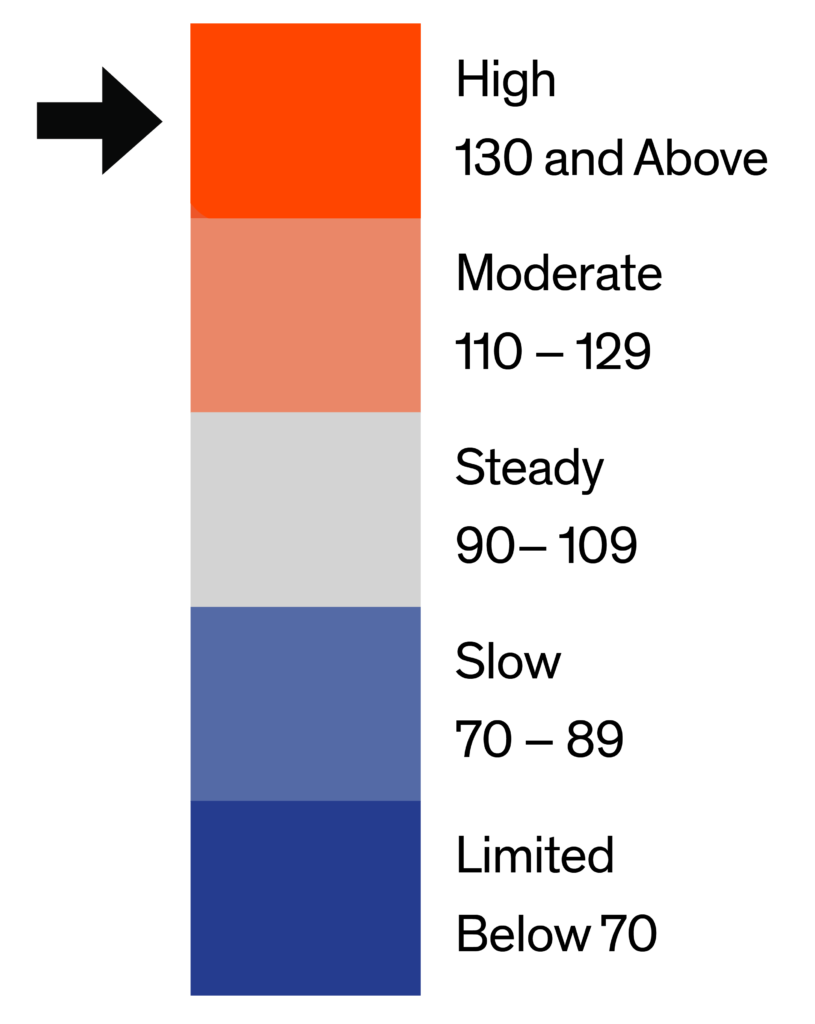
Demand for luxury condos remained in the High category with the Index rising eight percent to 157. Buyer interest remained stronger than other types of homes, although this segment accounts for only a small portion of metro area home sales and inventory. The months supply was up marginally to 3.2 in April.

Monthly Statistics for Condo Above $375k
Home Demand
Index
Index
157
(High)
Home Demand Index
from prior month
from prior month
146
Home Demand Index
from prior year
from prior year
177
Months of
Inventory
Inventory
3.2
Average daily inventory last month
94
Inventory sold
last month
last month
29
Bright MLS | T3 Home Demand Index
www.homedemandindex.com
Baltimore | May 2023
Townhouse/Rowhouse/Twin All prices
Townhouse/
Rowhouse/Twin
All prices
The Bright MLS | T3 Home Demand Index for townhouses rose eight percent in April to 100, a level consistent with a Steady pace of demand. The months supply rose to 1.9 from 1.7 months in March reflecting a rise in the number of listings and a decrease in sales over the month.

Monthly Statistics for Townhouse/Rowhouse/TwinAll prices
Home Demand
Index
Index
100
(Steady)
Home Demand Index
from prior month
from prior month
93
Home Demand Index
from prior year
from prior year
138
Months of
Inventory
Inventory
1.9
Average daily inventory last month
1,820
Inventory sold
last month
last month
949
Bright MLS | T3 Home Demand Index
www.homedemandindex.com
Note
1. This report is generated with data from the following counties:
- Baltimore Metro – Anne Arundel, MD; Baltimore City, MD; Baltimore, MD; Carroll, MD; Harford, MD; Howard, MD;
- DelMar Coastal – Somerset, MD; Sussex, DE; Wicomico, MD; Worcester, MD;
- Maryland Eastern Shore – Caroline, MD; Cecil, MD; Dorchester, MD; Kent, MD; Queen Annes, MD; Talbot, MD;
2. This report is for the May 2023 period with data collected from the previous month.
Released: May 11, 2023
Reference ID: 1826
Baltimore | May 2023
Home Demand Map (Zip Codes)
Across the Baltimore Metro area, demand for homes strengthened in Howard County, rising from Moderate to High in April. The Index remained in the Steady range in Baltimore County and was in the Slow category across the rest of the metro area. Demand was Steady in the DelMar Coastal and Maryland Eastern Shore market areas. Buyer interest in homes was High in just over one-fifth of ZIP codes, an increase from 15 percent in March. At the same time, the Index in roughly half of ZIP codes was in the Slow or Limited range, a decrease from 59 percent the previous month.

Bright MLS | T3 Home Demand Index
www.homedemandindex.com