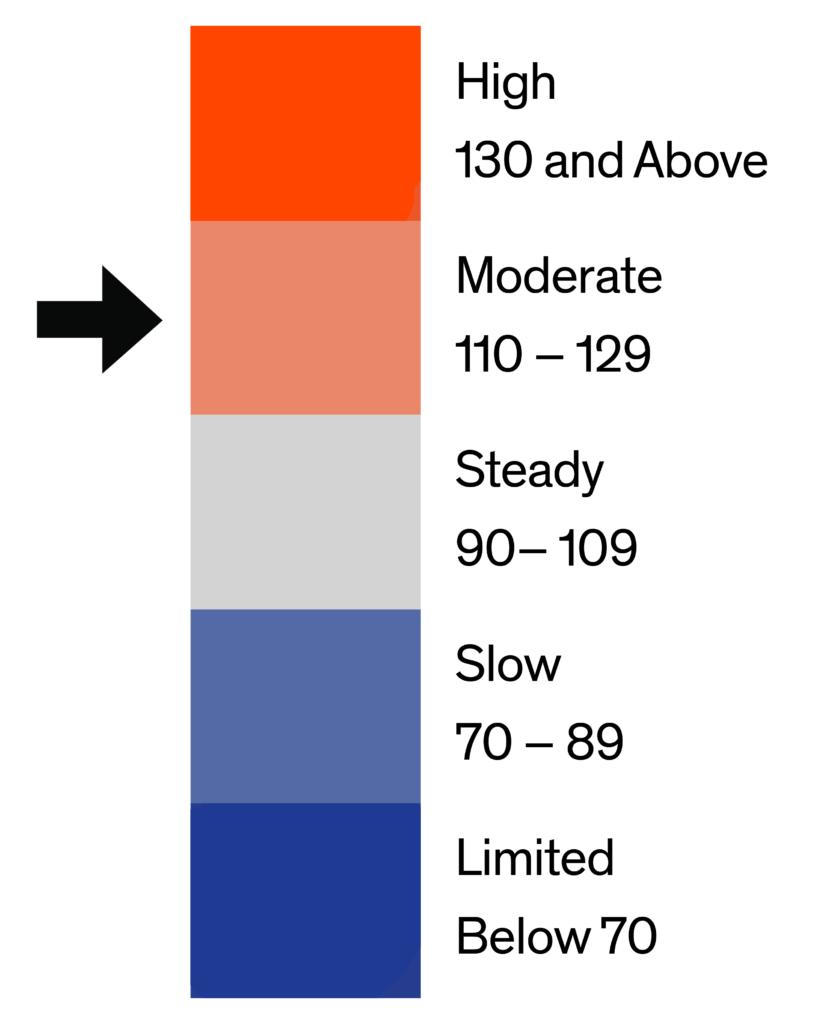
The Bright MLS | T3 Home Demand Index for the Baltimore MLS market area rose 12 percent in April to 153, a reading reflecting a High level of buyer demand. Demand was 56 percent higher than one year earlier, although a comparison with April 2020 largely reflects the sharp decline in demand and market disruptions in the early months of the pandemic.
Except for lower-priced single-family homes, demand rose in all segments of the market in April. Demand was strongest for higher-priced single-family and condo properties while lower-priced single-family homes continued a pattern of subdued demand. The month’s supply of homes ranged from a low of 0.8 for mid-priced single-family homes to a high of just 2.7 months for higher-priced condos.
Monthly Statistics for May 2021
Home Demand Index
153
(High)
Home Demand Index from prior month
137
Home Demand Index from prior year
98
Index change from prior month
11.7%
Index change from same time last year
56.1%
Bright MLS | T3 Home Demand Index
www.homedemandindex.com
Download tile as an image.
Embed this tile on your site.
Baltimore | May 2021
Home Demand Index | Historical Year-over-Year Comparison
Demand for homes in the Baltimore market area rose for the fourth consecutive month in April. The pace of growth slowed somewhat compared with the previous month, however. Buyer demand has exceeded the same month one year earlier in 10 of the past 12 months as buyers intensified their search for homes to take advantage of low mortgage interest rates and a brighter economic outlook.
Home Demand Index
Bright MLS | T3 Home Demand Index
www.homedemandindex.com
Download the top-level Market Areas map as a screenshot.
Embed this tile on your site.
Baltimore | May 2021
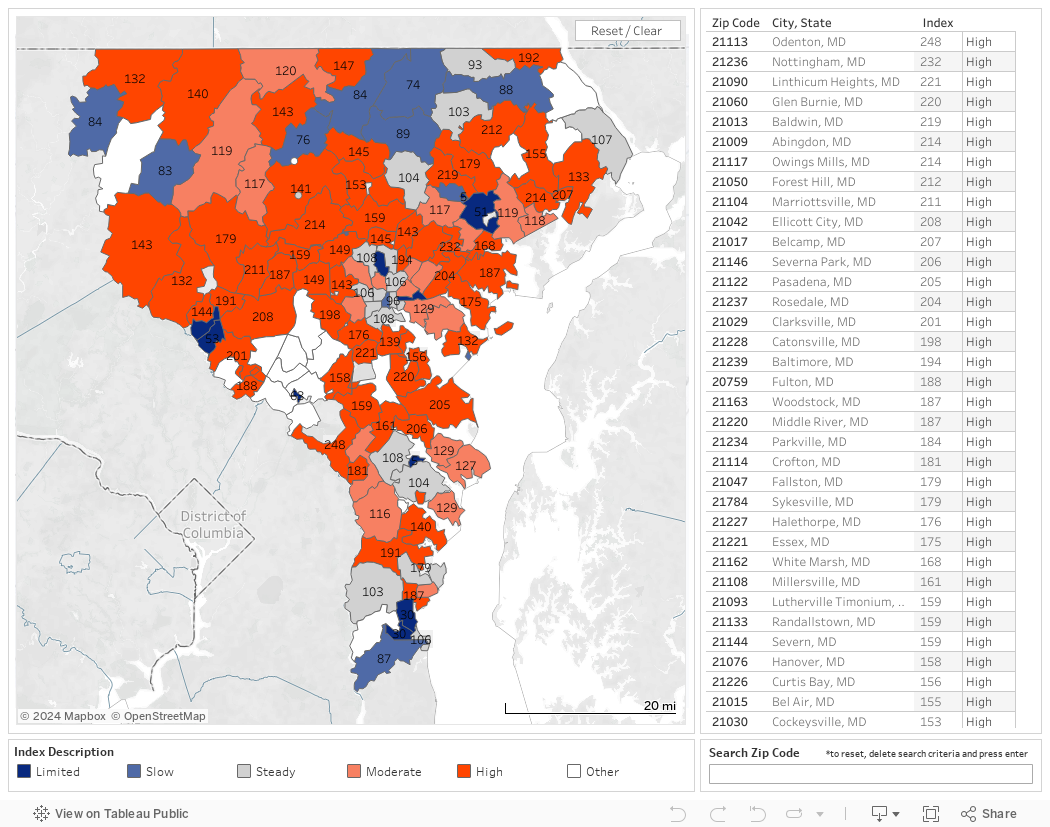
Home Demand Map
Half of the ZIP codes in the Baltimore market area recorded an April Index reading in the High category, about the same as the month before. Buyer interest in an additional 18 percent of ZIP codes was in the Moderate category. The remaining areas of weaker buyer demand were generally located in the periphery of the market area.
Bright MLS | T3 Home Demand Index
www.homedemandindex.com
Download tile as an image.
Embed this tile on your site.
Baltimore | May 2021
Demand and Inventory by Home Type
Except for lower-priced single-family homes, demand rose in all segments of the market in April. Demand was strongest for higher-priced single-family and condo properties while lower-priced single-family homes continued a pattern of subdued demand. The month’s supply of homes ranged from a low of 0.8 for mid-priced single-family homes to a high of just 2.7 months for higher-priced condos.
Bright MLS | T3 Home Demand Index
www.homedemandindex.com
Download tile as an image.
Baltimore | May 2021
Single Family Home Below $250k
Demand for lower-priced single-family homes was virtually unchanged in April compared with the previous month. The Index has remained at a level reflecting Limited demand for the past several months as some would-be buyers at this price point confronted declining affordability and a tenuous job market. There was a one-month supply of homes on the market in April, which is consistent with challenging inventory conditions across the entire Baltimore market area.
Monthly Statistics for Single Family Home Below $250k
Home Demand Index
67
(Limited)
Home Demand Index from prior month
68
Home Demand Index from prior year
91
Months of inventory
1
Average daily inventory last month
246
Inventory sold last month
251
Bright MLS | T3 Home Demand Index
www.homedemandindex.com
Download tile as an image.
Baltimore | May 2021
Single Family Home $250k - $590k
The Bright MLS | T3 Home Demand Index for mid-priced single-family homes rose by 14 percent in April, remaining in the High demand category for the second consecutive month. Demand rose despite a challenging inventory environment where the month’s supply has been among the lowest of any type of home in the Baltimore market area. In April there was a 0.8 months supply, down marginally from the previous month.
Monthly Statistics for Single Family Home $250k - $590k
Home Demand Index
165
(High)
Home Demand Index from prior month
145
Home Demand Index from prior year
100
Months of Inventory
0.8
Average daily inventory last month
926
Inventory sold last month
1,176
Bright MLS | T3 Home Demand Index
www.homedemandindex.com
Download tile as an image.
Baltimore | May 2021
Single Family Home Above $590k
Buyer interest in single-family homes priced above $590,000 rose by 15 percent in April to a reading of 259, the third month in a row of High demand in this segment. There was a 1.3 months supply of homes for sale in April, down from 1.6 months in March, consistent with an overall trend of tightening inventory conditions among most market segments in the Baltimore market area since the beginning of the year.
Monthly Statistics for Single Family Home Above $590k
Home Demand Index
259
(High)
Home Demand Index from prior month
226
Home Demand Index from prior year
113
Months of Inventory
1.3
Average daily inventory last month
558
Inventory sold last month
432
Bright MLS | T3 Home Demand Index
www.homedemandindex.com
Download tile as an image.
Baltimore | May 2021
Condo Below $310k
Demand for lower-priced condos, a market segment accounting for six percent of sales in April, was essentially unchanged with an Index reading of 126. Buyer interest has been in the Steady or Moderate category for the past several months. Like other segments of the market, would-be buyers found their search for a condo challenging. The month’s supply was 1.1 in April, unchanged from the previous month.
Monthly Statistics for Condo Below $310k
Home Demand Index
126
(Moderate)
Home Demand Index from prior month
124
Home Demand Index from prior year
90
Months of Inventory
1.1
Average daily inventory last month
243
Inventory sold last month
231
Bright MLS | T3 Home Demand Index
www.homedemandindex.com
This is Tooltip!
Baltimore | May 2021
Condo Above $310k
Buyer interest in higher-priced condos rose eight percent to a reading of 280 reflecting a High level of demand. Demand for homes in this segment has been consistently strong over the past several months, often posting the highest Index reading among all home types. The month’s supply of homes for sale was 2.7 in April, down from three months in March.
Monthly Statistics for Condo Above $310k
Home Demand Index
280
(High)
Home Demand Index from prior month
259
Home Demand Index from prior year
83
Months of Inventory
2.7
Average daily inventory last month
166
Inventory sold last month
62
Bright MLS | T3 Home Demand Index
www.homedemandindex.com
This is Tooltip!
Baltimore | May 2021
Townhouse/Rowhouse/Twin All prices
Townhouse/ Rowhouse/Twin All prices
The Bright MLS | Home Demand Index for the townhouse segment posted a solid increase in April reflecting a High level of buyer interest. Townhouses account for more than 40 percent of listings and sales in the Baltimore market area and have been an appealing option for buyers finding limited inventory in the single-family market. In April, there was a 1.1 months supply of homes available for sale, down marginally from March.
Monthly Statistics for Townhouse/Rowhouse/TwinAll prices
Home Demand Index
167
(High)
Home Demand Index from prior month
149
Home Demand Index from prior year
97
Months of Inventory
1.1
Average daily inventory last month
1,770
Inventory sold last month
1,633
Bright MLS | T3 Home Demand Index
www.homedemandindex.com
Note
1. This report is generated with data from the following counties: Anne Arundel, MD; Baltimore City, MD; Baltimore, MD; Carroll, MD; Harford, MD; Howard, MD
2. This report is for the May 2021 period with data collected from the previous month.
Released: May 11, 2021
Reference ID: 1175
Baltimore | May 2021
Home Demand Map (Zip Codes)
Half of the ZIP codes in the Baltimore market area recorded an April Index reading in the High category, about the same as the month before. Buyer interest in an additional 18 percent of ZIP codes was in the Moderate category. The remaining areas of weaker buyer demand were generally located in the periphery of the market area.
Bright MLS | T3 Home Demand Index
www.homedemandindex.com
Embed the Timeline
To embed the map on your website, copy and paste the code below. Please note that the ideal dimensions for displaying the map are 1312 pixels wide by 660 pixels high.
Embed the Map
To embed the map on your website, copy and paste the code below. Please note that the ideal dimensions for displaying the map are 1312 pixels wide by 1182 pixels high.
Embed the Housing Type Bar Chart
To embed the map on your website, copy and paste the code below. Please note that the ideal dimensions for displaying the map are 1312 pixels wide by 880 pixels high.