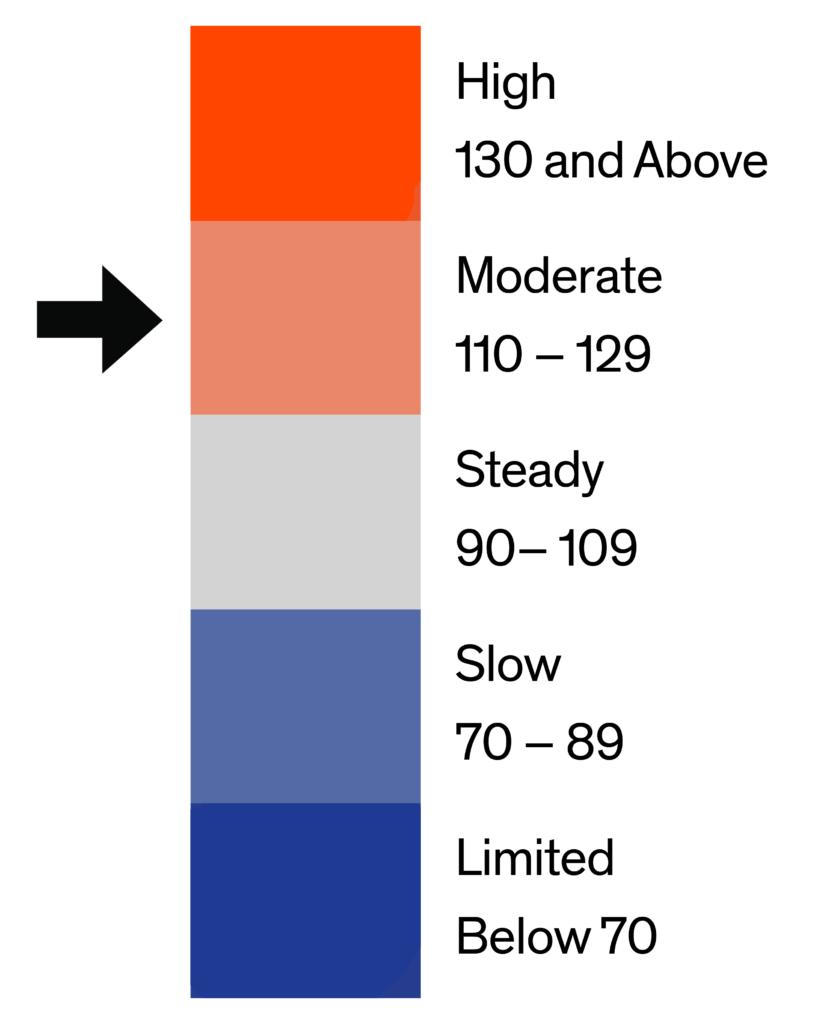
Demand for homes in the Baltimore MLS market area rose 16 percent in February according to the latest reading of the Bright MLS | T3 Home Demand Index. Overall, buyer interest was in the Moderate category, representing an increase in activity over the month from a Steady reading one month earlier. Compared with one year earlier, the Index was 13 percent lower, suggesting that demand was on a lower trajectory than last year.
Home demand among the six types of homes tracked by the Bright MLS | T3 Home Demand Index was generally higher than the previous month, but in several instances was not as high as one year earlier. Lower-priced single-family homes recorded the weakest demand, while higher-priced condos and single-family homes experienced the greatest level of buyer interest. Inventory conditions continued to be challenging for buyers with the months supply ranging from 0.9 for mid-priced single-family homes to 4.8 for higher-priced condos.
Monthly Statistics for March 2021
Home Demand Index
110
(Moderate)
Home Demand Index from prior month
95
Home Demand Index from prior year
126
Index change from prior month
15.8%
Index change from same time last year
-12.7%
Bright MLS | T3 Home Demand Index
www.homedemandindex.com
Download tile as an image.
Embed this tile on your site.
Baltimore | March 2021
Home Demand Index | Historical Year-over-Year Comparison
The Bright MLS | T3 Home Demand Index rose for the second consecutive month after reaching a seasonal low in December. Even with the increase, however, buyer interest was somewhat lower than last year when home demand accelerated as buyers rushed to lock-in low mortgage interest rates. Buyer interest remained at an elevated level in the second half of 2020 compared with the previous year following the unusual spring decline in activity as pandemic-related disruptions sidelined buyers.
Home Demand Index
Bright MLS | T3 Home Demand Index
www.homedemandindex.com
Download the top-level Market Areas map as a screenshot.
Embed this tile on your site.
Baltimore | March 2021
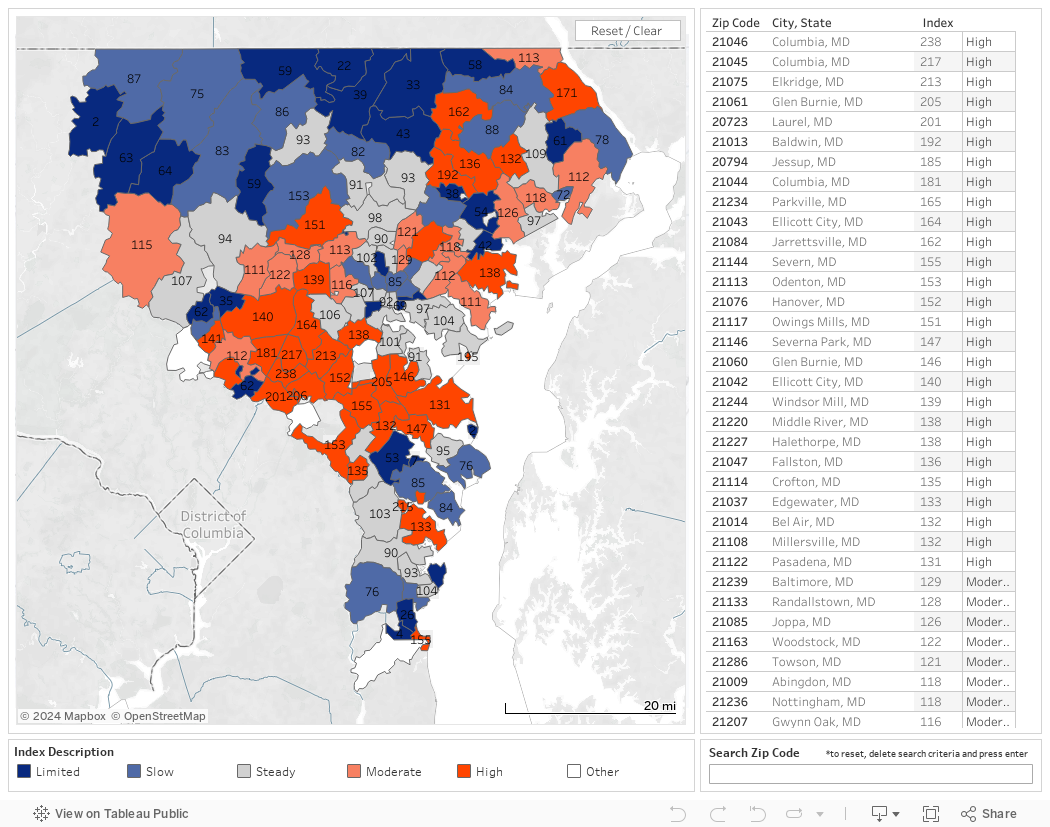
Home Demand Map
Across the Baltimore market area, one-quarter of ZIP codes recorded a Bright MLS | T3 Home Demand Index in the High category with an additional 15 percent in the Moderate category. Most of these areas were concentrated in the close-in suburbs around Baltimore City. Buyer demand in one-third of ZIP codes, mostly in the northern portion of the market area, was in the Slow or Limited category.
Bright MLS | T3 Home Demand Index
www.homedemandindex.com
Download tile as an image.
Embed this tile on your site.
Baltimore | March 2021
Demand and Inventory by Home Type
Home demand among the six types of homes tracked by the Bright MLS | T3 Home Demand Index was generally higher than the previous month, but in several instances was not as high as one year earlier. Lower-priced single-family homes recorded the weakest demand, while higher-priced condos and single-family homes experienced the greatest level of buyer interest. Inventory conditions continued to be challenging for buyers with the months supply ranging from 0.9 for mid-priced single-family homes to 4.8 for higher-priced condos.
Bright MLS | T3 Home Demand Index
www.homedemandindex.com
Download tile as an image.
Baltimore | March 2021
Single Family Home Below $250k
Buyer interest in single-family homes priced below $250,000 remained low with an Index reading in the Limited category in February, despite a small increase of nine percent over the month. Would-be buyers at this price point have been disproportionately affected by the economic recession, while at the same time the relatively low number of homes for sale has reduced search options for buyers. The months supply of homes for sale was just 1.1 in February, down from 1.3 one month before.
Monthly Statistics for Single Family Home Below $250k
Home Demand Index
60
(Limited)
Home Demand Index from prior month
55
Home Demand Index from prior year
118
Months of inventory
1.1
Average daily inventory last month
254
Inventory sold last month
223
Bright MLS | T3 Home Demand Index
www.homedemandindex.com
Download tile as an image.
Baltimore | March 2021
Single Family Home $250k - $590k
The Bright MLS | T3 Home Demand Index for mid-priced single-family homes rose a solid 15 percent in February to a reading of 110, reflecting a Moderate level of buyer interest. Demand was 11 percent lower than one year earlier, however. Inventory conditions will likely remain challenging for buyers. Homes in this price range accounted for 21 percent of listings among the six types of homes tracked by the Index, but for a much greater 30 percent of sales resulting in a months supply of homes for sale of only 0.9.
Monthly Statistics for Single Family Home $250k - $590k
Home Demand Index
110
(Moderate)
Home Demand Index from prior month
96
Home Demand Index from prior year
124
Months of Inventory
0.9
Average daily inventory last month
707
Inventory sold last month
807
Bright MLS | T3 Home Demand Index
www.homedemandindex.com
Download tile as an image.
Baltimore | March 2021
Single Family Home Above $590k
Demand for higher-priced single-family homes rose by nearly one-third in February. The Index recorded a reading of 160, which reflected a High level of buyer interest. Unlike lower-priced single-family home segments, demand was marginally higher than one year earlier. Although still low, the 1.9 months supply was higher than most other types of homes in the Baltimore market area.
Monthly Statistics for Single Family Home Above $590k
Home Demand Index
160
(High)
Home Demand Index from prior month
122
Home Demand Index from prior year
153
Months of Inventory
1.9
Average daily inventory last month
434
Inventory sold last month
223
Bright MLS | T3 Home Demand Index
www.homedemandindex.com
Download tile as an image.
Baltimore | March 2021
Condo Below $310k
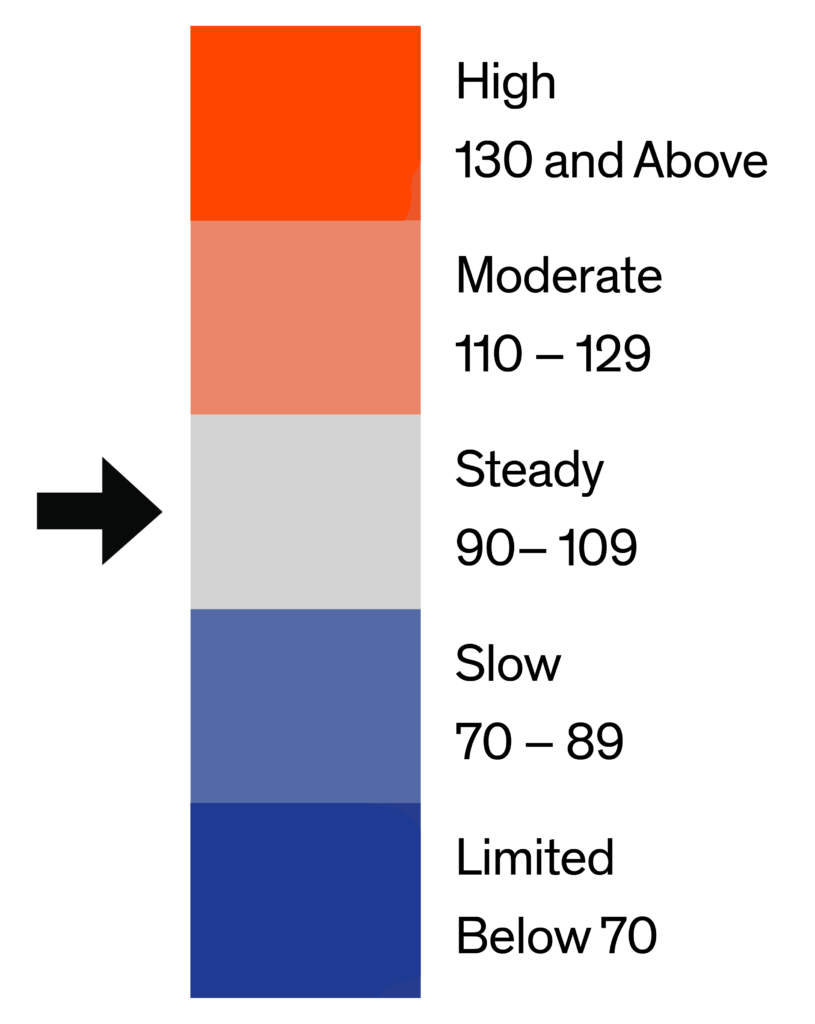
The Bright MLS | T3 Home Demand Index for lower-priced condos fell slightly in February but remained in the Steady category. The level of buyer interest was also lower than one year ago. The inventory of condos for sale was equivalent to a 1.4 months supply, marginally higher than similarly priced single-family home segments.
Monthly Statistics for Condo Below $310k
Home Demand Index
109
(Steady)
Home Demand Index from prior month
112
Home Demand Index from prior year
129
Months of Inventory
1.4
Average daily inventory last month
259
Inventory sold last month
188
Bright MLS | T3 Home Demand Index
www.homedemandindex.com
This is Tooltip!
Baltimore | March 2021
Condo Above $310k
Demand for condos priced above $310,000 rose by one-third in February and was 10 percent ahead of one year earlier. While the months supply was 4.8, higher than any other type of home tracked but the Index, the number of condos in this category available for sale accounted for only four percent of all listings, providing little relief for generally tight inventory conditions in the Baltimore market area.
Monthly Statistics for Condo Above $310k
Home Demand Index
185
(High)
Home Demand Index from prior month
140
Home Demand Index from prior year
168
Months of Inventory
4.8
Average daily inventory last month
130
Inventory sold last month
27
Bright MLS | T3 Home Demand Index
www.homedemandindex.com
This is Tooltip!
Baltimore | March 2021
Townhouse/Rowhouse/Twin All prices
Townhouse/ Rowhouse/Twin All prices
The Bright MLS | T3 Home Demand Index for the townhouse segment rose in February to a reading in the Moderate category and was comparable with the level of buyer interest one year earlier. This segment drives a large portion of the Baltimore market, accounting for nearly half of sales and listings. Despite its relative size, the number of homes available for sale compared with buyer demand was low, with a months supply of just 1.3.
Monthly Statistics for Townhouse/Rowhouse/TwinAll prices
Home Demand Index
124
(Moderate)
Home Demand Index from prior month
107
Home Demand Index from prior year
124
Months of Inventory
1.3
Average daily inventory last month
1,561
Inventory sold last month
1,243
Bright MLS | T3 Home Demand Index
www.homedemandindex.com
Note
1. This report is generated with data from the following counties: Anne Arundel, MD; Baltimore City, MD; Baltimore, MD; Carroll, MD; Harford, MD; Howard, MD
2. This report is for the March 2021 period with data collected from the previous month.
Released: March 11, 2021
Reference ID: 1141
Baltimore | March 2021
Home Demand Map (Zip Codes)
Across the Baltimore market area, one-quarter of ZIP codes recorded a Bright MLS | T3 Home Demand Index in the High category with an additional 15 percent in the Moderate category. Most of these areas were concentrated in the close-in suburbs around Baltimore City. Buyer demand in one-third of ZIP codes, mostly in the northern portion of the market area, was in the Slow or Limited category.
Bright MLS | T3 Home Demand Index
www.homedemandindex.com
Embed the Timeline
To embed the map on your website, copy and paste the code below. Please note that the ideal dimensions for displaying the map are 1312 pixels wide by 660 pixels high.
Embed the Map
To embed the map on your website, copy and paste the code below. Please note that the ideal dimensions for displaying the map are 1312 pixels wide by 1182 pixels high.
Embed the Housing Type Bar Chart
To embed the map on your website, copy and paste the code below. Please note that the ideal dimensions for displaying the map are 1312 pixels wide by 880 pixels high.