Share report on Facebook!
Share on facebook
Share report on Twitter!
Share on twitter
Share report on LinkedIn!
Share on linkedin
Email a link to this Report!
Share on email
Download tile as an image.

Baltimore Metro | July 2026

Home Demand Index

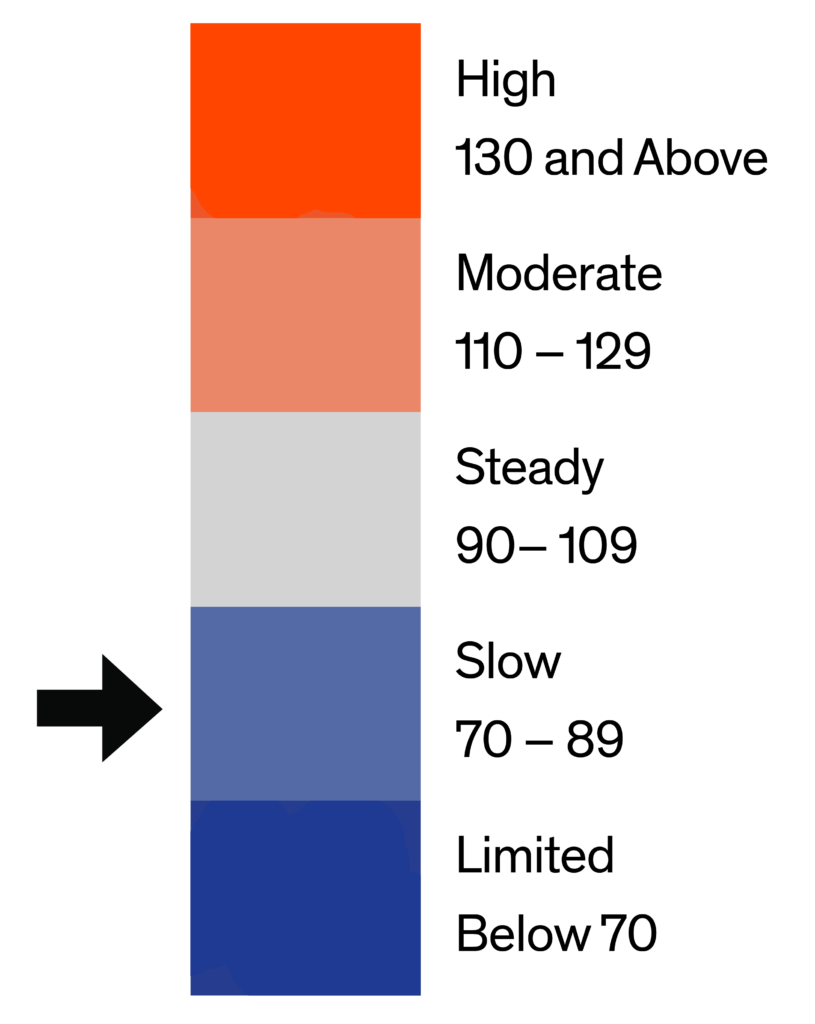
The Home Demand Index (HDI) for the Baltimore metro area stands at 84 for this report period, up four points from 80 last month and below the 96 recorded during the same period one year ago. The four-point month-over-month gain is a counter-seasonal result, July typically marks a deceleration from the June peak as the active selling window narrows, and suggests that a cohort of buyers motivated by the brief rate-dip window that opened during May and June closed transactions into early July, extending the demand signal one period beyond the seasonal ceiling that most years arrives in June. The twelve-point year-over-year deficit, while meaningful, should be read against the unusually strong July 2025 baseline, when the Baltimore metro was completing an extended spring cycle that had been supported by regional employment stability and a temporary easing in rate-lock psychology; the absolute level of 84 reflects a functioning Slow-territory summer market rather than a structural deterioration in demand fundamentals. The widening spread between the condo tiers, which are running at Steady and Moderate levels, and the entry single-family tier, which remains in Limited territory at 62, continues to define the most important cross-segment dynamic in this market, as buyers facing persistent affordability friction at the lowest detached price points migrate into the attached inventory that offers more accessible entry thresholds in a market where financing sensitivity remains the primary demand governor.
Demand by home type in Baltimore shows a divergent pattern this period that stands in contrast to the broad-based softening observed in the previous period, with the metro-wide counter-seasonal recovery to 84 driven primarily by strength in the attached and upper-tier segments while the entry single-family floor remains constrained. The most notable development across the tier structure is the surge in entry condo demand to 110, a twenty-point month-over-month gain from the previous reading of 90 that represents the largest single-tier sequential move in the current reporting cycle and has pushed this segment into Steady territory for the first time in recent periods. Luxury condos at 124, a ten-point gain from 114 last month, reinforced this signal with a Moderate-range reading that is the highest absolute index across any tier in the metro. Luxury single-family homes at 108 declined three points from 111 last month but remain in Steady territory, while mid single-family held flat at 81 and entry single-family ticked up one point to 62, the latter remaining in Limited territory and continuing to reflect the most acute affordability compression in the metro at the sub-$375,000 detached price point. The townhouse, rowhouse, and twin home segment gained seven points to 87, a Slow-territory reading consistent with the metro average and suggesting that the attached single-family category is contributing meaningfully to the counter-seasonal demand signal alongside the condo tiers. The emerging divergence between a strong attached market and a constrained entry SF market is the defining structural dynamic in Baltimore’s current demand picture.
Monthly Statistics for July 2026
Home Demand
Index
84
(Slow)
Home Demand Index
from prior month
80
Home Demand Index
from prior year
96
Index change
from prior month
4%
Index change from
same time last year
-12%
Bright MLS | T3 Home Demand Index

www.homedemandindex.com

Download tile as an image.
Embed this tile on your site.

Baltimore Metro | July 2026

Home Demand Index | Historical Year-over-Year Comparison

Over the past 12 months, Baltimore’s Home Demand Index traced a pronounced seasonal arc, holding around 90 from July through September of last year before declining through the fall and bottoming at 57 in December, followed by a measured winter recovery that carried through January and February at 73 and 77, respectively, before accelerating into a spring rebound that reached 90 in March and 93 in April. The pattern then moderated to 80 in May, with the current period registering 84, a counter-seasonal four-point gain that interrupts the expected summer deceleration and suggests that late-closing spring buyers are extending demand into the early summer reporting window. At 84, the index trails the 96 posted at this point last year by twelve points, a gap that reflects the comparative strength of the prior-year period more than the comparative weakness of the current period; that prior-year reading was itself elevated by an unusually active spring cycle that sustained momentum well into the summer, making it an above-average baseline against which current demand will naturally appear softer regardless of underlying conditions. The prior-year comparison line runs consistently above the current trajectory across the trailing 12-month window, with the gap widest through the spring months and beginning to converge toward the summer and fall periods where last year’s numbers also moderated, suggesting the year-over-year differential should narrow further through the second half of 2026 as the prior-year baseline softens.

Home Demand Index

Bright MLS | T3 Home Demand Index

www.homedemandindex.com

Download the top-level Market Areas map as a screenshot.

Embed this tile on your site.

Baltimore Metro | July 2026

Home Demand Map

Regional demand across the Baltimore metro continues to reflect its established geographic hierarchy, with the counter-seasonal four-point gain to 84 distributed unevenly across submarkets in ways that are consistent with the price-tier and income-profile characteristics of each county. Howard County is likely sustaining the strongest absolute demand readings within the metro, supported by its move-up buyer pipeline, strong school district appeal, and a household income profile that makes the mid-to-upper single-family price range more accessible relative to financing costs, and the strongest demand conditions are most plausibly concentrated here given the profile of buyers who are closing late-spring decisions. Harford and Baltimore counties are both tracking in Steady territory, while Anne Arundel and Carroll counties are both tracking in Slow territory, reflecting a broadly functional but constrained demand environment where buyer engagement is present but measured, particularly in the entry and mid single-family tiers where financing cost sensitivity is most acute. Baltimore City remains the softest submarket in the metro, registering in the Limited range where structural affordability barriers, limited accessible inventory, and more cautious buyer sentiment continue to suppress transactional engagement, a pattern that has persisted throughout the current cycle and is unlikely to resolve materially without either a sustained decline in financing costs or the emergence of meaningful entry-level inventory below the thresholds at which the City’s buyer pool can qualify and transact at scale.
Bright MLS | T3 Home Demand Index

www.homedemandindex.com

Download tile as an image.
Embed this tile on your site.

Baltimore Metro | July 2026

Demand and Inventory by Home Type

Demand by home type in Baltimore shows a divergent pattern this period that stands in contrast to the broad-based softening observed in the previous period, with the metro-wide counter-seasonal recovery to 84 driven primarily by strength in the attached and upper-tier segments while the entry single-family floor remains constrained. The most notable development across the tier structure is the surge in entry condo demand to 110, a twenty-point month-over-month gain from the previous reading of 90 that represents the largest single-tier sequential move in the current reporting cycle and has pushed this segment into Steady territory for the first time in recent periods. Luxury condos at 124, a ten-point gain from 114 last month, reinforced this signal with a Moderate-range reading that is the highest absolute index across any tier in the metro. Luxury single-family homes at 108 declined three points from 111 last month but remain in Steady territory, while mid single-family held flat at 81 and entry single-family ticked up one point to 62, the latter remaining in Limited territory and continuing to reflect the most acute affordability compression in the metro at the sub-$375,000 detached price point. The townhouse, rowhouse, and twin home segment gained seven points to 87, a Slow-territory reading consistent with the metro average and suggesting that the attached single-family category is contributing meaningfully to the counter-seasonal demand signal alongside the condo tiers. The emerging divergence between a strong attached market and a constrained entry SF market is the defining structural dynamic in Baltimore’s current demand picture.
Bright MLS | T3 Home Demand Index

www.homedemandindex.com

Download tile as an image.

Baltimore Metro | July 2026

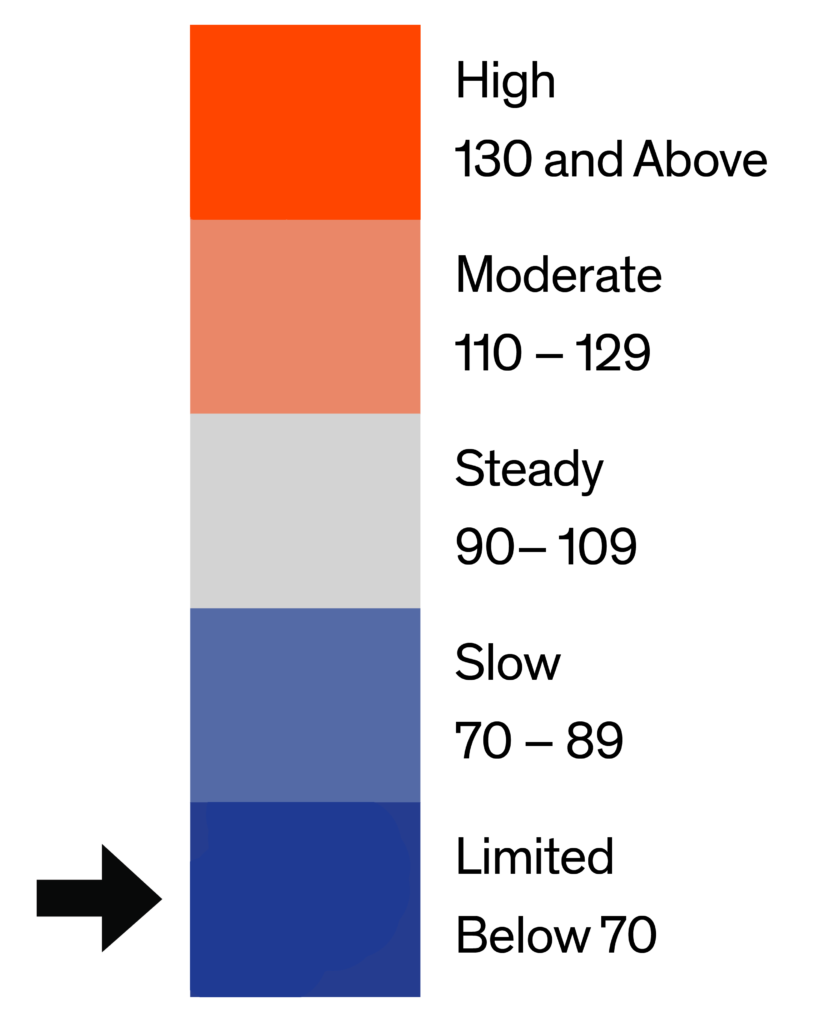
The index for entry-level single-family homes in Baltimore stands at 62 this report period, up marginally from 61 last month and below the 74 recorded one year ago. The one-point month-over-month gain is notable primarily for its contrast with June’s pronounced decline, as the entry tier appears to have reached a near-term floor while not participating meaningfully in the counter-seasonal gains observed across the attached segments, a pattern consistent with the compounded affordability barriers that constrain first-time and value-driven buyers at the sub-$375,000 price point, where the combination of elevated home prices, a 6.5-to-7-percent rate environment, and limited accessible inventory creates a structural ceiling on buyer activity that does not respond to the same incremental demand signals that animate the mid-range and luxury markets. The twelve-point year-over-year shortfall indicates that entry single-family demand in Baltimore is tracking materially below the same period last year across what continues to be the metro’s most rate-sensitive and affordability-compressed buyer cohort, with any meaningful recovery in this segment remaining contingent on a sustained decline in financing costs, a moderation in entry-level home prices at the sub-threshold price points that align with the financial capacity of first-time buyers in this market, or the emergence of sufficient accessible inventory to allow latent demand to convert into transactional activity.
Home Demand
Index
62
(Limited)
Home Demand Index
from prior month
61
Home Demand Index
from prior year
74
Months of
inventory
Average daily inventory last month
Inventory sold
last month
Bright MLS | T3 Home Demand Index

www.homedemandindex.com

Download tile as an image.

Baltimore Metro | July 2026

Mid-range single-family homes in Baltimore registered an index of 81 this report period, flat with the previous month’s 81 and below the previous year’s reading of 98. The absence of month-over-month movement is in itself a meaningful data point, as the mid-range tier held its previous month’s level through the typically softer period, suggesting that the move-up buyer cohort in this segment has settled into a measured but stable pace of activity rather than either accelerating into the counter-seasonal trend visible in the attached segments or retreating further as the peak selling window closes. At 1.7 months of inventory across 1,563 active listings and 929 monthly sales, supply remains tight in a manner consistent with the rate-lock dynamic that has suppressed seller-side participation throughout the current cycle, which is both a constraint on buyer choice and a support for the demand index by preventing supply from rising to a level that would allow buyers to become more selective. The seventeen-point year-over-year shortfall relative to the previous year’s reading of 98 reflects the elevated baseline set during the prior-year period, when the regional market was still carrying forward momentum from an unusually active spring cycle, and should be expected to narrow through the fall and winter as the prior-year comparison softens to levels that are more representative of average mid-range demand conditions in this metro.
Home Demand
Index
81
(Slow)
Home Demand Index
from prior month
81
Home Demand Index
from prior year
98
Months of
Inventory
Average daily inventory last month
Inventory sold
last month
Bright MLS | T3 Home Demand Index

www.homedemandindex.com

Download tile as an image.

Baltimore Metro | July 2026

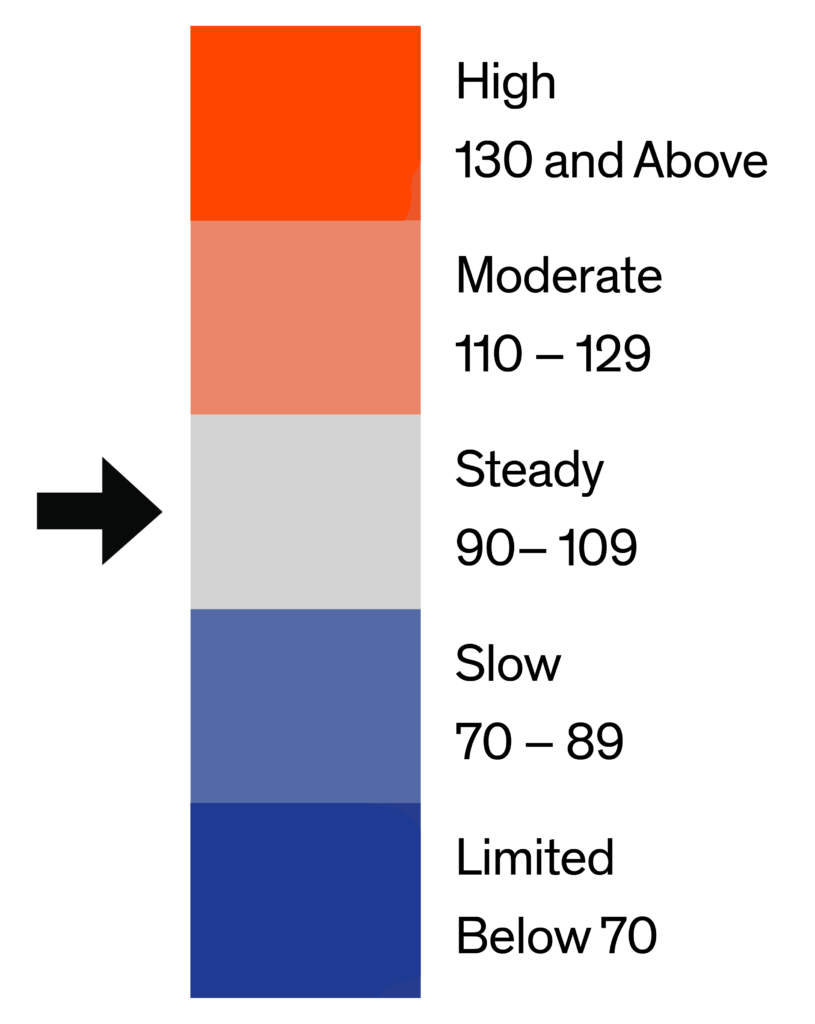
The index for luxury single-family homes in Baltimore stands at 108 this report period, down three points from 111 last month and below last year’s reading of 131. The modest three-point month-over-month decline signals a minor seasonal deceleration among high-end buyers following a strong spring cycle, consistent with the discretionary nature of luxury demand as premium inventory absorbs initial buyer activity and the seasonal transition from the peak-urgency window to a more selective summer pace reduces the frequency of competitive transaction events in this tier. At 108, luxury single-family demand remains in Steady territory and is the highest-index detached segment in the metro, a position it has held consistently through the spring and early summer cycle, reflecting the comparative insulation of above-$860,000 buyers from the financing cost sensitivity that is the primary demand governor at lower price points. The twenty-three-point year-over-year gap relative to the previous year’s 131, which was itself a Moderate-range reading, reflects the cooling from what was an unusually active luxury cycle in summer 2025 rather than a deterioration in the structural demand base; at 1.9 months of inventory against 362 monthly sales, the absorption pace in this segment remains competitive.
Home Demand
Index
108
(Steady)
Home Demand Index
from prior month
111
Home Demand Index
from prior year
131
Months of
Inventory
Average daily inventory last month
Inventory sold
last month
Bright MLS | T3 Home Demand Index

www.homedemandindex.com

Download tile as an image.

Baltimore Metro | July 2026

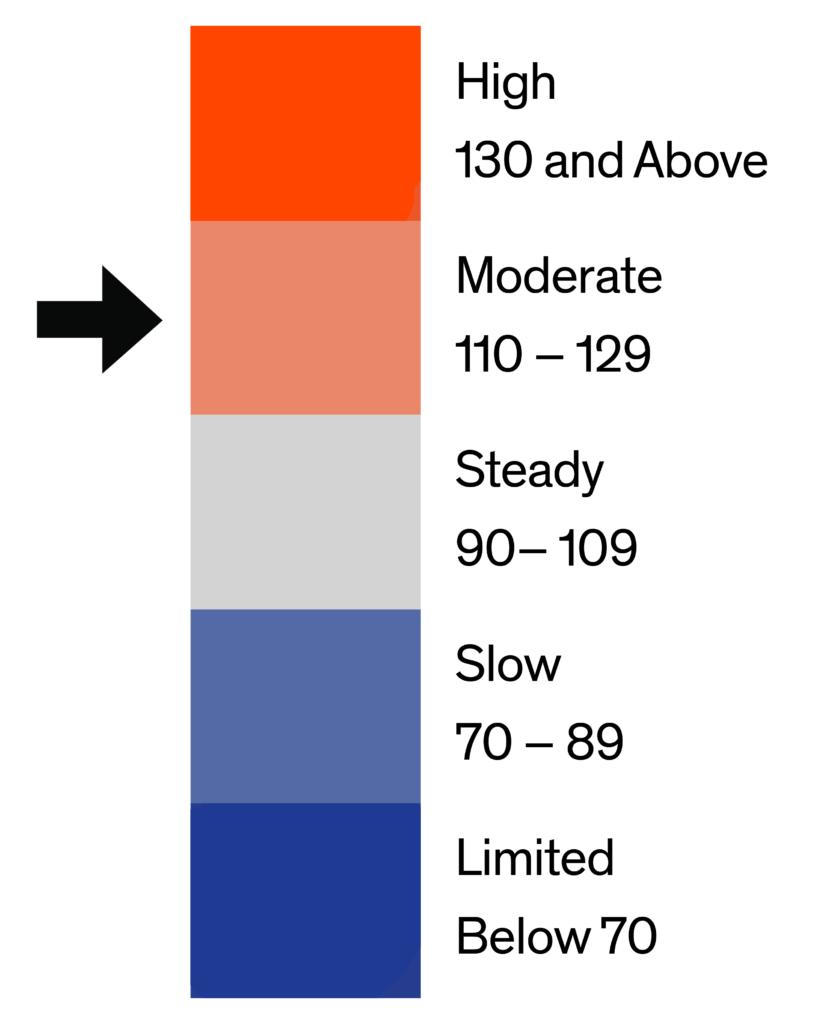
Entry-level condo demand in Baltimore stands at 110 this report period, up twenty points from 90 last month and below last year’s level of 125. The twenty-point month-over-month surge is the most significant sequential gain across any segment in the Baltimore metro this period and has pushed entry condo demand into Moderate territory, a threshold that represents a meaningful shift in buyer engagement at the sub-$415,000 attached price point and suggests that buyers who have been priced out of or deterred by the entry single-family market are converting into the condo tier at an accelerating pace as the affordability arbitrage between detached and attached property at comparable price points becomes more compelling in a sustained high-rate environment. The structural role of the entry condo segment as the primary affordability outlet in the Baltimore metro, where the sub-$375,000 single-family index sits at 62 while the equivalent condo tier runs at 110, is the clearest expression of the market’s bifurcated demand dynamics, and the twenty-point jump this period suggests that this affordability substitution effect is intensifying rather than moderating as the summer progresses. The fifteen-point year-over-year shortfall from last year’s 125 is the relevant medium-term context, but the near-term direction signal is materially more constructive than the prior-month reading would have implied.
Home Demand
Index
110
(Moderate)
Home Demand Index
from prior month
90
Home Demand Index
from prior year
125
Months of
Inventory
Average daily inventory last month
Inventory sold
last month
Bright MLS | T3 Home Demand Index

www.homedemandindex.com

This is Tooltip!

Baltimore Metro | July 2026

Luxury condo demand in Baltimore registered 124 this report period, up ten points from 114 last month and below last year’s level of 160. The ten-point month-over-month gain extends the counter-seasonal trend visible across the attached segment and has pushed luxury condo demand into Moderate territory, the highest-rated segment in the Baltimore metro this period and a reading that reflects the strongest concentration of active buyer engagement anywhere in the market. At 3.2 months of inventory across only 133 active listings and 42 monthly sales, this is a thin market where relatively modest shifts in buyer participation produce meaningful index movement, and the ten-point gain should be read in that context; nonetheless, a Moderate-range reading in what is typically a seasonally softer period is a noteworthy signal of sustained demand depth among the downsizing, lifestyle-driven, and discretionary buyer cohorts that define participation at the above-$415,000 attached price point. The thirty-six-point year-over-year shortfall relative to the previous year’s level of 160, which was an above-Moderate reading, reflects the normalization from an exceptional prior-year luxury condo cycle rather than a deterioration in current-period demand fundamentals, and at 124 the segment is performing at a level that is consistent with healthy absorption of available premium attached inventory.
Home Demand
Index
124
(Moderate)
Home Demand Index
from prior month
114
Home Demand Index
from prior year
160
Months of
Inventory
Average daily inventory last month
Inventory sold
last month
Bright MLS | T3 Home Demand Index

www.homedemandindex.com

This is Tooltip!

Baltimore Metro | July 2026

The index for townhouses, rowhouses, and twin homes in Baltimore stands at 87 this report period, up seven points from 80 last month and below last year’s level of 94. The seven-point month-over-month gain makes this segment a meaningful contributor to the metro’s counter-seasonal recovery, consistent with the broader pattern of attached and townhouse demand outperforming detached single-family categories in a sustained high-rate environment where the price accessibility and location efficiency of attached single-family formats continue to attract buyers who have been priced out of or deterred by the detached market. At 3.0 months of inventory across 3,267 active listings and 1,092 monthly sales, the townhouse segment is the highest-volume component of the Baltimore demand picture and its movement is the most structurally significant signal for understanding metro-wide demand health, the seven-point sequential gain to 87 in a historically softer current report period is therefore a constructive indicator that underlying demand for this format remains durable heading into the mid-summer period. The seven-point year-over-year shortfall relative to the previous year’s 94 is the narrowest annual gap across any single-family or attached segment in the metro this period, suggesting that townhouse and rowhouse demand has normalized more fully against the prior-year baseline than the detached SF tiers and is operating closer to its structural equilibrium level.
Home Demand
Index
87
(Slow)
Home Demand Index
from prior month
80
Home Demand Index
from prior year
94
Months of
Inventory
Average daily inventory last month
Inventory sold
last month
Bright MLS | T3 Home Demand Index

www.homedemandindex.com

Note

2. This report is for the July 2026 period with data collected from the previous month.
Released: July 11, 2026
Reference ID: 2451

Baltimore Metro | July 2026

Home Demand Map (Zip Codes)

Regional demand across the Baltimore metro continues to reflect its established geographic hierarchy, with the counter-seasonal four-point gain to 84 distributed unevenly across submarkets in ways that are consistent with the price-tier and income-profile characteristics of each county. Howard County is likely sustaining the strongest absolute demand readings within the metro, supported by its move-up buyer pipeline, strong school district appeal, and a household income profile that makes the mid-to-upper single-family price range more accessible relative to financing costs, and the strongest demand conditions are most plausibly concentrated here given the profile of buyers who are closing late-spring decisions. Harford and Baltimore counties are both tracking in Steady territory, while Anne Arundel and Carroll counties are both tracking in Slow territory, reflecting a broadly functional but constrained demand environment where buyer engagement is present but measured, particularly in the entry and mid single-family tiers where financing cost sensitivity is most acute. Baltimore City remains the softest submarket in the metro, registering in the Limited range where structural affordability barriers, limited accessible inventory, and more cautious buyer sentiment continue to suppress transactional engagement, a pattern that has persisted throughout the current cycle and is unlikely to resolve materially without either a sustained decline in financing costs or the emergence of meaningful entry-level inventory below the thresholds at which the City’s buyer pool can qualify and transact at scale.
Bright MLS | T3 Home Demand Index

www.homedemandindex.com

Embed the Timeline

To embed the map on your website, copy and paste the code below. Please note that the ideal dimensions for displaying the map are 1312 pixels wide by 660 pixels high.

Embed the Map

To embed the map on your website, copy and paste the code below. Please note that the ideal dimensions for displaying the map are 1312 pixels wide by 1182 pixels high.

Embed the Housing Type Bar Chart

To embed the map on your website, copy and paste the code below. Please note that the ideal dimensions for displaying the map are 1312 pixels wide by 880 pixels high.