July 2021 Report
Baltimore Metro
Baltimore | July 2021
Home Demand Index
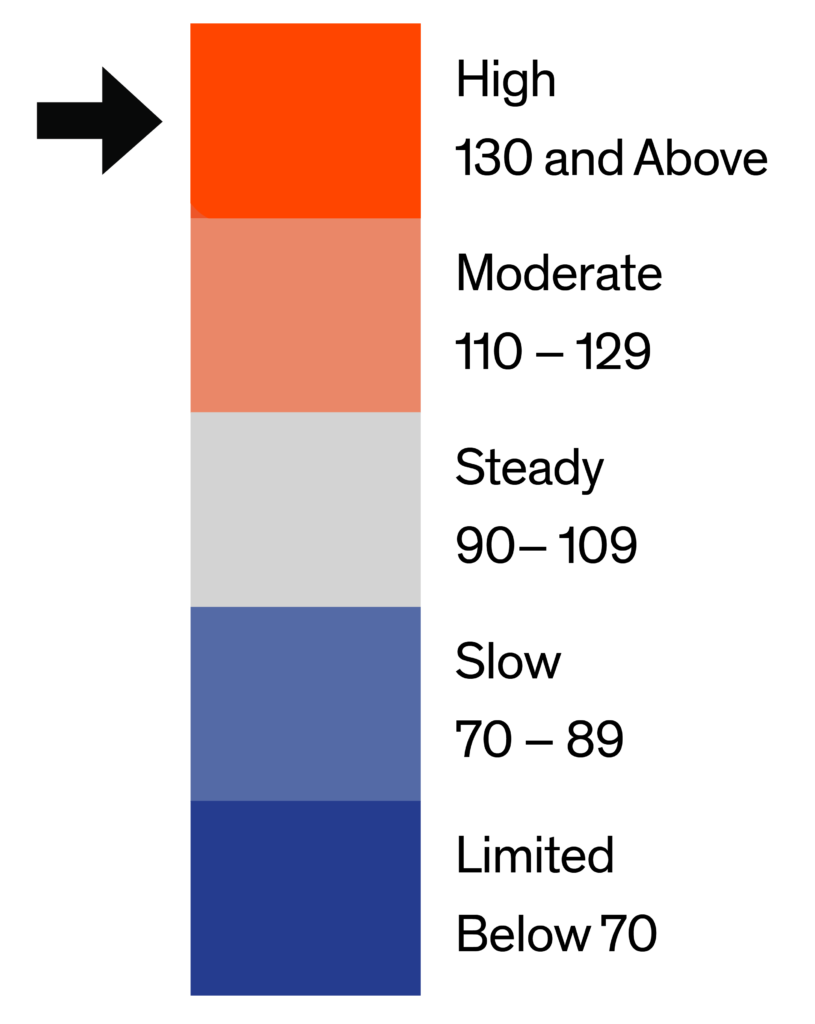
Demand for homes in the Baltimore MLS market area remained in the High range despite a small decline in June. The Bright MLS | T3 Home Demand Index fell by nearly three percent over the month to a reading of 145. Compared with one year earlier, the Index was two percent higher.
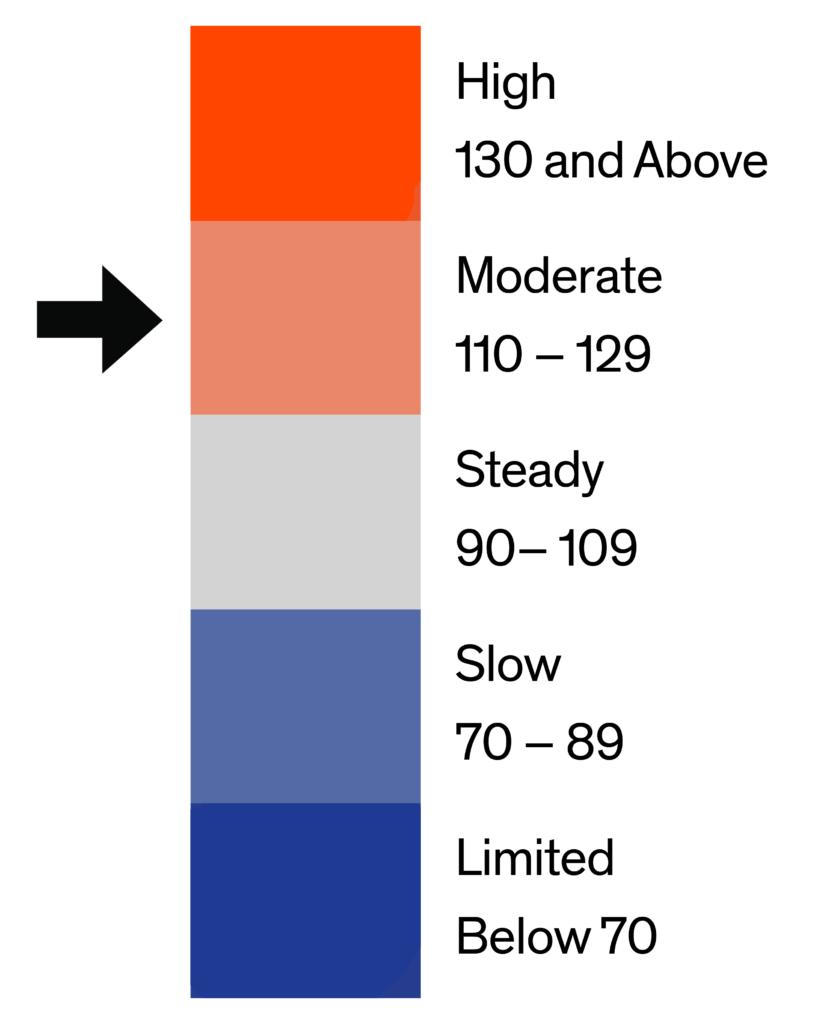
Consistent with the past several months, the lower-priced single-family segment exhibited the weakest demand in June, although the Index rose slightly over the month. Demand for condos rose marginally, while buyer interest in mid-priced single-family homes declined. Among all types of homes, higher-priced single-family homes and condos exhibited the strongest buyer interest. Inventory conditions remained extremely tight among all types of homes ranging from 0.7 months supply for mid-priced single-family homes to 2.1 months supply for higher-priced condos. While the months supply for each condo segment fell, inventory conditions were little changed among other types of homes.

Monthly Statistics for July 2021
Home Demand
Index
Index
145
(High)
Home Demand Index
from prior month
from prior month
149
Home Demand Index
from prior year
from prior year
142
Index change
from prior month
from prior month
-2.7%
Index change from
same time last year
same time last year
2.1%
Bright MLS | T3 Home Demand Index
www.homedemandindex.com
Baltimore | July 2021
Home Demand Index | Historical Year-over-Year Comparison
June marked the fourth consecutive month that the Index was in the High range. While demand remained strong, buyer interest has softened somewhat since April. The five percent decline during the past two months can be attributed to several factors including a continued rise in home prices, which has hampered affordability, and low inventory levels among all types of Baltimore area homes.
Home Demand Index
Bright MLS | T3 Home Demand Index
www.homedemandindex.com
Baltimore | July 2021
Home Demand Map
Fifty-five percent of ZIP codes in the Baltimore market area recorded a June Index in the High category, slightly more than the month before. Buyer interest in an additional 17 percent of ZIP codes was in the Moderate category. The remaining areas of softer buyer demand were generally located in and near Baltimore City and in the southern-most portion of the market area.
Bright MLS | T3 Home Demand Index
www.homedemandindex.com
Baltimore | July 2021
Demand and Inventory by Home Type
Consistent with the past several months, the lower-priced single-family segment exhibited the weakest demand in June, although the Index rose slightly over the month. Demand for condos rose marginally, while buyer interest in mid-priced single-family homes declined. Among all types of homes, higher-priced single-family homes and condos exhibited the strongest buyer interest. Inventory conditions remained extremely tight among all types of homes ranging from 0.7 months supply for mid-priced single-family homes to 2.1 months supply for higher-priced condos. While the months supply for each condo segment fell, inventory conditions were little changed among other types of homes.
Bright MLS | T3 Home Demand Index
www.homedemandindex.com
Baltimore | July 2021
Single Family Home Below $250k
The Bright MLS | T3 Home Demand Index for lower-priced single-family homes rose nine percent to a reading of 70 indicating a Slow pace of demand. Buyer interest had been in the Limited category for several months, with the June rise marking the first increase since March. The months supply of homes was 1.1, up from a one-month supply in May. Both greater demand and a slight increase in homes for sale suggest a higher pace of activity category in the coming months.

Monthly Statistics for Single Family Home Below $250k
Home Demand
Index
Index
70
(Slow)
Home Demand Index
from prior month
from prior month
64
Home Demand Index
from prior year
from prior year
96
Months of
inventory
inventory
1.1
Average daily inventory last month
275
Inventory sold
last month
last month
244
Bright MLS | T3 Home Demand Index
www.homedemandindex.com
Baltimore | July 2021
Single Family Home $250k - $590k
Demand for mid-priced single-family homes in the Baltimore market area fell in June to an Index of 152. Although still in the High demand category, the decline in the Index during the month was greater than other types of homes. Inventory conditions for would-be buyers have continued to tighten. The months supply of homes for sale was just 0.7, down over the month and the fifth consecutive month with less than a one-month supply.

Monthly Statistics for Single Family Home $250k - $590k
Home Demand
Index
Index
152
(High)
Home Demand Index
from prior month
from prior month
166
Home Demand Index
from prior year
from prior year
146
Months of
Inventory
Inventory
0.7
Average daily inventory last month
1,130
Inventory sold
last month
last month
1,525
Bright MLS | T3 Home Demand Index
www.homedemandindex.com
Baltimore | July 2021
Single Family Home Above $590k
Buyer interest in higher-priced single-family homes was unchanged over the month. Demand has been at an elevated level for several months and was second only to buyer interest in higher-priced condos in June. Inventory conditions continued to tighten with the months supply declining to 1.2 in June from 1.9 months in February.

Monthly Statistics for Single Family Home Above $590k
Home Demand
Index
Index
270
(High)
Home Demand Index
from prior month
from prior month
270
Home Demand Index
from prior year
from prior year
224
Months of
Inventory
Inventory
1.2
Average daily inventory last month
739
Inventory sold
last month
last month
627
Bright MLS | T3 Home Demand Index
www.homedemandindex.com
Baltimore | July 2021
Condo Below $310k
The Index for lower-priced condos rose slightly in June, with demand remaining in the Moderate category. Demand was unchanged compared with the same month one year earlier. Like most other types of Baltimore area homes, the number of homes for sale continued to be low relative to the elevated demand from would-be buyers. There was a one-month supply in June, down from 1.2 in May.

Monthly Statistics for Condo Below $310k
Home Demand
Index
Index
129
(Moderate)
Home Demand Index
from prior month
from prior month
124
Home Demand Index
from prior year
from prior year
129
Months of
Inventory
Inventory
1
Average daily inventory last month
254
Inventory sold
last month
last month
263
Bright MLS | T3 Home Demand Index
www.homedemandindex.com
Baltimore | July 2021
Condo Above $310k
Demand for higher-priced condos remained at an extraordinarily high level in June. The Index, at 286, was higher than the month before and has shown increasing strength since the beginning of the year. The months supply, at 2.1, was down from 2.4 in May largely due to an increase in sales.

Monthly Statistics for Condo Above $310k
Home Demand
Index
Index
286
(High)
Home Demand Index
from prior month
from prior month
283
Home Demand Index
from prior year
from prior year
177
Months of
Inventory
Inventory
2.1
Average daily inventory last month
168
Inventory sold
last month
last month
79
Bright MLS | T3 Home Demand Index
www.homedemandindex.com
Baltimore | July 2021
Townhouse/Rowhouse/Twin All prices
Townhouse/
Rowhouse/Twin
All prices
The Bright MLS | T3 Home Demand Index for townhouses was down slightly in June, but still in the High demand category. Compared with one year earlier, demand was marginally higher. There was a one-month supply of homes for sale, down from the May level of 1.1 months. Inventory conditions have tightened since February when there was a 1.3 months supply of townhouses available for sale.

Monthly Statistics for Townhouse/Rowhouse/TwinAll prices
Home Demand
Index
Index
151
(High)
Home Demand Index
from prior month
from prior month
152
Home Demand Index
from prior year
from prior year
145
Months of
Inventory
Inventory
1
Average daily inventory last month
1,984
Inventory sold
last month
last month
1,926
Bright MLS | T3 Home Demand Index
www.homedemandindex.com
Note
1. This report is generated with data from the following counties:
- Baltimore Metro – Anne Arundel, MD; Baltimore City, MD; Baltimore, MD; Carroll, MD; Harford, MD; Howard, MD;
- DelMar Coastal – Somerset, MD; Sussex, DE; Wicomico, MD; Worcester, MD;
- Maryland Eastern Shore – Caroline, MD; Cecil, MD; Dorchester, MD; Kent, MD; Queen Annes, MD; Talbot, MD;
2. This report is for the July 2021 period with data collected from the previous month.
Released: July 11, 2021
Reference ID: 1314
Baltimore | July 2021
Home Demand Map (Zip Codes)
Fifty-five percent of ZIP codes in the Baltimore market area recorded a June Index in the High category, slightly more than the month before. Buyer interest in an additional 17 percent of ZIP codes was in the Moderate category. The remaining areas of softer buyer demand were generally located in and near Baltimore City and in the southern-most portion of the market area.
Bright MLS | T3 Home Demand Index
www.homedemandindex.com