January 2023 Report
Baltimore Metro
Baltimore | January 2023
Home Demand Index
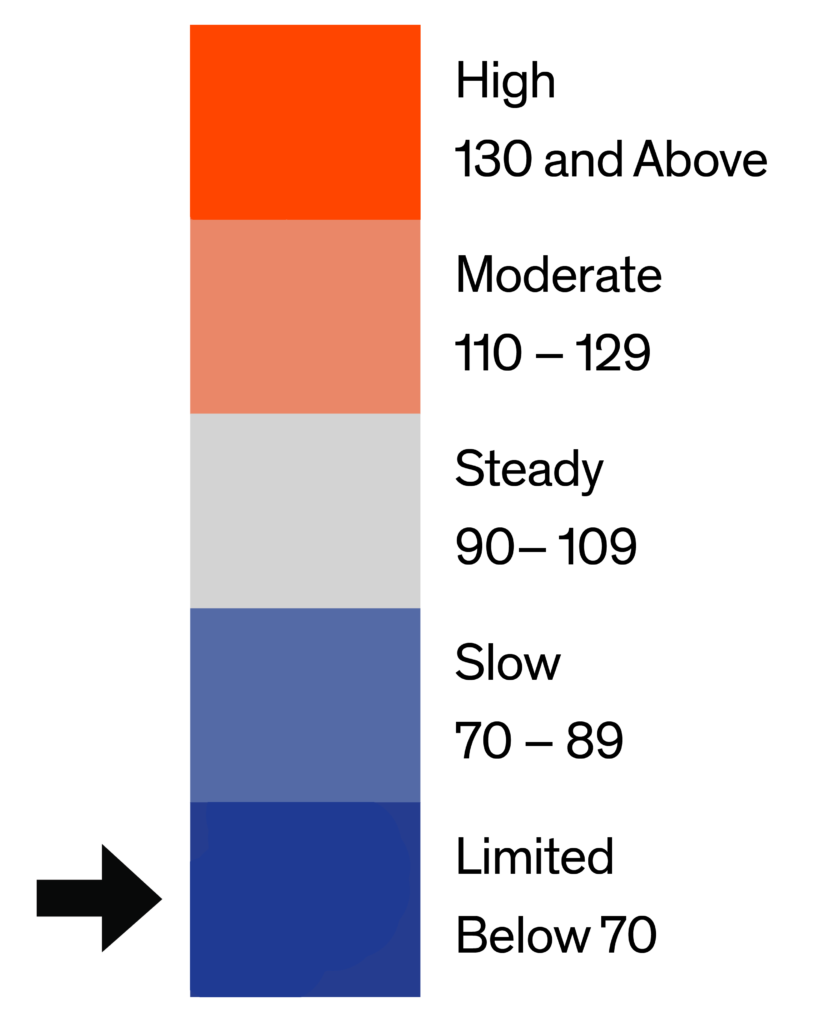
The Bright MLS | T3 Home Demand Index for the Baltimore Metro area fell 20.5 percent to 62 in December, reflecting Limited buyer interest. The Index was 16.2 percent lower than one year earlier when demand was at a Slow pace.
The December Index was lower for each type of home compared with the month before. Demand for higher-priced single-family homes and higher-priced condos fell the most. Buyer interest was strongest for higher-priced condos, where demand was in the Moderate range, followed by higher-priced single-family homes where demand was Steady. All other segments were in the Slow or Limited demand category. The months supply for each type of home fell in December mostly due to a decrease in the number of listings available for sale. The months supply ranged from 1.6 months for lower-priced condos to 2.4 months for townhouses.

Monthly Statistics for January 2023
Home Demand
Index
Index
62
(Limited)
Home Demand Index
from prior month
from prior month
78
Home Demand Index
from prior year
from prior year
74
Index change
from prior month
from prior month
-20.5%
Index change from
same time last year
same time last year
-16.2%
Bright MLS | T3 Home Demand Index
www.homedemandindex.com
Baltimore | January 2023
Home Demand Index | Historical Year-over-Year Comparison
Demand for homes in the Baltimore Metro area has decreased steadily since August and remained below the year-earlier pace during the past 12 months. The softening of buyer activity reflects several forces, including higher mortgage rates and uncertainty about the economy along with the usual seasonal slowdown in the market at the end of the year.
Home Demand Index
Bright MLS | T3 Home Demand Index
www.homedemandindex.com
Baltimore | January 2023
Home Demand Map
Buyer interest in homes across the Baltimore Metro area was Slow in Howard and Baltimore counties and Limited in the other counties in the metro. The Index was lower in each Baltimore Metro area county in December compared with November. Demand was Limited in the DelMar Coastal area and the Maryland Eastern Shore area. Across the Greater Baltimore market area, demand in 80 percent of ZIP codes was in the Slow or Limited range compared with 68 percent in November.
Bright MLS | T3 Home Demand Index
www.homedemandindex.com
Baltimore | January 2023
Demand and Inventory by Home Type
The December Index was lower for each type of home compared with the month before. Demand for higher-priced single-family homes and higher-priced condos fell the most. Buyer interest was strongest for higher-priced condos, where demand was in the Moderate range, followed by higher-priced single-family homes where demand was Steady. All other segments were in the Slow or Limited demand category. The months supply for each type of home fell in December mostly due to a decrease in the number of listings available for sale. The months supply ranged from 1.6 months for lower-priced condos to 2.4 months for townhouses.
Bright MLS | T3 Home Demand Index
www.homedemandindex.com
Baltimore | January 2023
Single Family Home Below $250k
Demand for lower-priced single-family homes changed little in December. The Index, at 26, was consistent with Limited buyer interest which has characterized this segment of the Baltimore Metro market for several months. The months supply was just 1.8 months, a decrease from the month before, as the number of listings decreased while sales were steady compared with November.

Monthly Statistics for Single Family Home Below $250k
Home Demand
Index
Index
26
(Limited)
Home Demand Index
from prior month
from prior month
28
Home Demand Index
from prior year
from prior year
36
Months of
inventory
inventory
1.8
Average daily inventory last month
224
Inventory sold
last month
last month
122
Bright MLS | T3 Home Demand Index
www.homedemandindex.com
Baltimore | January 2023
Single Family Home $250k - $590k
Demand for mid-priced single-family homes slipped from Steady to Limited in December. The Index, at 63, was 20 percent lower over the month. The months supply was unchanged at just 1.9 months as both listings and sales decreased in tandem.

Monthly Statistics for Single Family Home $250k - $590k
Home Demand
Index
Index
63
(Limited)
Home Demand Index
from prior month
from prior month
79
Home Demand Index
from prior year
from prior year
79
Months of
Inventory
Inventory
1.9
Average daily inventory last month
1,107
Inventory sold
last month
last month
588
Bright MLS | T3 Home Demand Index
www.homedemandindex.com
Baltimore | January 2023
Single Family Home Above $590k
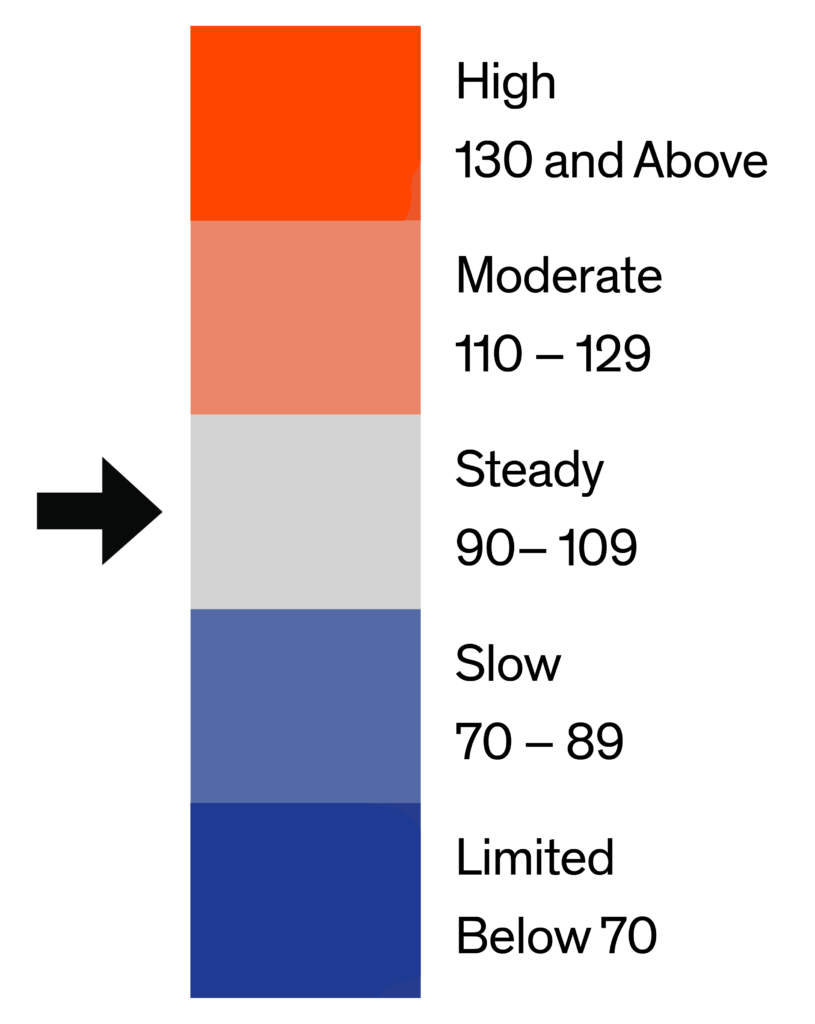
The Bright MLS | T3 Home Demand Index for higher-priced single-family homes fell by nearly one-third in December. The Index, at 98, reflected a Steady pace of demand, down from High demand in November. Pricier homes have been most exposed to higher mortgage rates suggesting that some would-be buyers at this price point may be reevaluating their purchase plans. The months supply fell to 2.3 months from 2.7 months in November.

Monthly Statistics for Single Family Home Above $590k
Home Demand
Index
Index
98
(Steady)
Home Demand Index
from prior month
from prior month
142
Home Demand Index
from prior year
from prior year
100
Months of
Inventory
Inventory
2.3
Average daily inventory last month
592
Inventory sold
last month
last month
255
Bright MLS | T3 Home Demand Index
www.homedemandindex.com
Baltimore | January 2023
Condo Below $310k
Like all other segments of the market, demand for lower-priced condos fell in December. The Index decreased to 57 reflecting Limited buyer demand. Demand was in the Slow range in November. The months supply, at 1.6, fell marginally in December and was lower than any other type of Baltimore Metro area home.

Monthly Statistics for Condo Below $310k
Home Demand
Index
Index
57
(Limited)
Home Demand Index
from prior month
from prior month
71
Home Demand Index
from prior year
from prior year
76
Months of
Inventory
Inventory
1.6
Average daily inventory last month
185
Inventory sold
last month
last month
115
Bright MLS | T3 Home Demand Index
www.homedemandindex.com
Baltimore | January 2023
Condo Above $310k
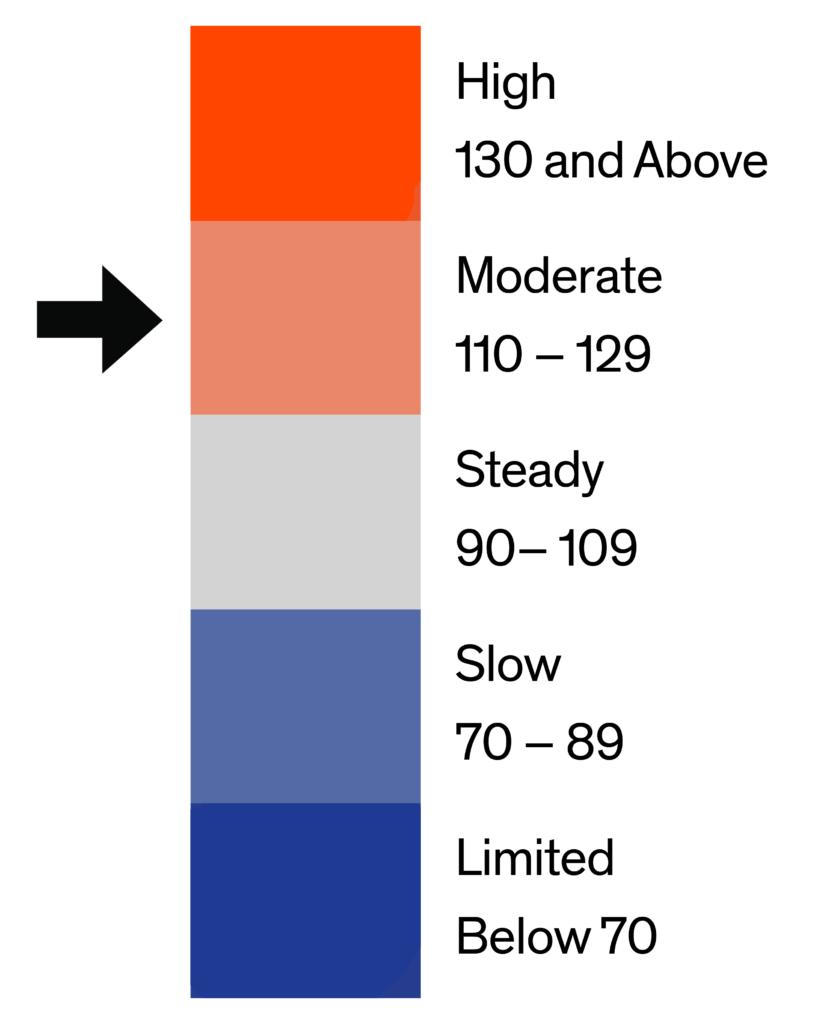
Buyer interest in higher-priced condos was stronger than any other segment of the market in December. The Index, at 111, was consistent with a Moderate pace of demand. The months supply was just 1.7 in December, down from 3.1 months in November. It should be noted that higher-priced condos make up a small segment of the market and month-to-month changes in sales and listings can results in large changes in months supply.

Monthly Statistics for Condo Above $310k
Home Demand
Index
Index
111
(Moderate)
Home Demand Index
from prior month
from prior month
187
Home Demand Index
from prior year
from prior year
175
Months of
Inventory
Inventory
1.7
Average daily inventory last month
102
Inventory sold
last month
last month
59
Bright MLS | T3 Home Demand Index
www.homedemandindex.com
Baltimore | January 2023
Townhouse/Rowhouse/Twin All prices
Townhouse/
Rowhouse/Twin
All prices
The Index for the townhouse segment fell to 72 but remained in the Slow category of demand. The months supply fell to 2.4 months from 2.8 months but was still higher than any other type of Baltimore Metro area home. This segment accounted for half of the available inventory in December, ultimately driving much of the activity in the Baltimore Metro area market.

Monthly Statistics for Townhouse/Rowhouse/TwinAll prices
Home Demand
Index
Index
72
(Slow)
Home Demand Index
from prior month
from prior month
88
Home Demand Index
from prior year
from prior year
82
Months of
Inventory
Inventory
2.4
Average daily inventory last month
2,170
Inventory sold
last month
last month
888
Bright MLS | T3 Home Demand Index
www.homedemandindex.com
Note
1. This report is generated with data from the following counties:
- Baltimore Metro – Anne Arundel, MD; Baltimore City, MD; Baltimore, MD; Carroll, MD; Harford, MD; Howard, MD;
- DelMar Coastal – Somerset, MD; Sussex, DE; Wicomico, MD; Worcester, MD;
- Maryland Eastern Shore – Caroline, MD; Cecil, MD; Dorchester, MD; Kent, MD; Queen Annes, MD; Talbot, MD;
2. This report is for the January 2023 period with data collected from the previous month.
Released: January 11, 2023
Reference ID: 1745
Baltimore | January 2023
Home Demand Map (Zip Codes)
Buyer interest in homes across the Baltimore Metro area was Slow in Howard and Baltimore counties and Limited in the other counties in the metro. The Index was lower in each Baltimore Metro area county in December compared with November. Demand was Limited in the DelMar Coastal area and the Maryland Eastern Shore area. Across the Greater Baltimore market area, demand in 80 percent of ZIP codes was in the Slow or Limited range compared with 68 percent in November.

Bright MLS | T3 Home Demand Index
www.homedemandindex.com