The Bright MLS | T3 Home Demand Index for the Baltimore MLS market area declined in December to a level of 87, reflecting a market that exhibited a Slow pace of buyer interest. Despite the decrease of 16 percent over the month, the Index remained 26 percent above the year-earlier level, suggesting buyer interest remained solid even after accounting for the usual seasonal pullback in demand.
The Bright MLS | T3 Home Demand Index for the Baltimore market area fell for each type of home in December, which was consistent with the typical decline in buyer interest in the late fall and winter months. Except for the lowest-priced single-family home segment, buyer interest remained higher than one year earlier due to a combination of factors including favorable mortgage financing conditions and pent-up demand from earlier in the year. For would-be buyers, the number of homes available for sales was very tight. The months supply was at or below 1.5 months in each segment of the market except for higher-priced condos.
Monthly Statistics for January 2021
Home Demand Index
87
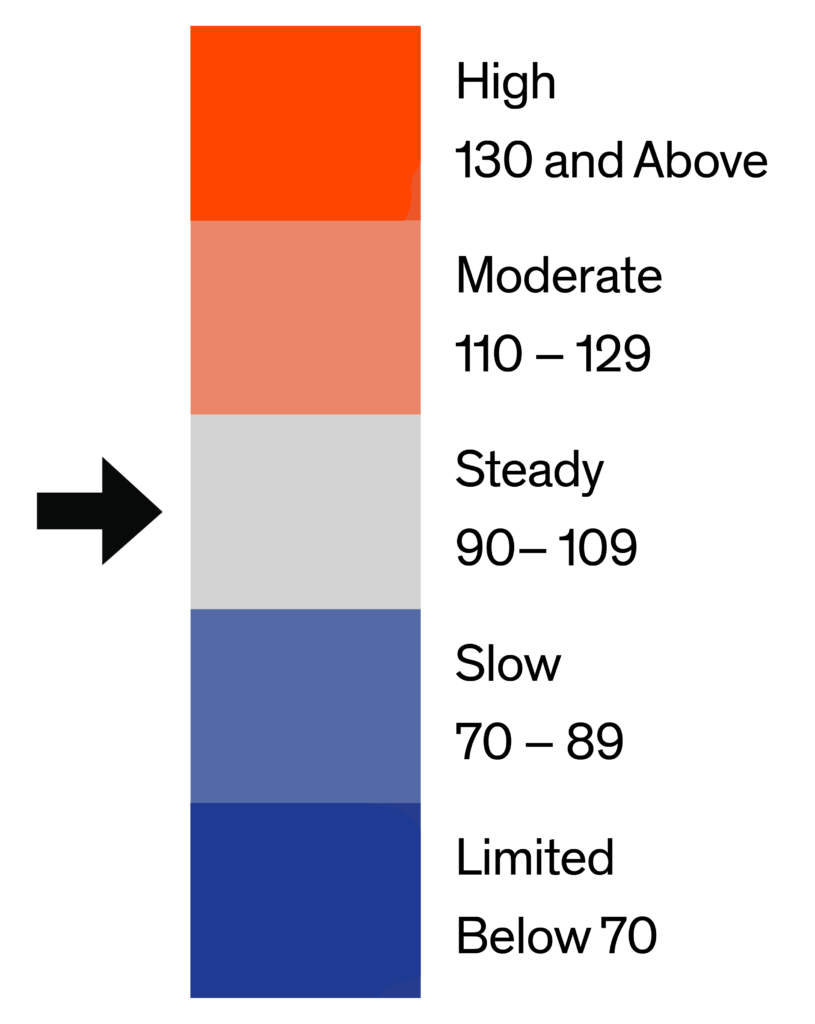
(Slow)
Home Demand Index from prior month
104
Home Demand Index from prior year
69
Index change from prior month
-16.3%
Index change from same time last year
26.1%
Bright MLS | T3 Home Demand Index
www.homedemandindex.com
Download tile as an image.
Embed this tile on your site.
Baltimore | January 2021
Home Demand Index | Historical Year-over-Year Comparison
For most of 2020, buyer interest in homes in the Baltimore market area was significantly higher compared with the same period one year earlier. Low mortgage interest rates were one of the factors propelling buyer interest as would-be buyers sought to lock-in favorable financing. Some of the strength can also be attributed to the disruption in the spring real estate market brought on by the Covid-19 pandemic which delayed some transactions that were then pushed forward to the summer months. In November and December, home demand softened, reflecting the typical pattern of fewer home purchases in the late fall and winter months.
Home Demand Index
Bright MLS | T3 Home Demand Index
www.homedemandindex.com
Download the top-level Market Areas map as a screenshot.
Embed this tile on your site.
Baltimore | January 2021
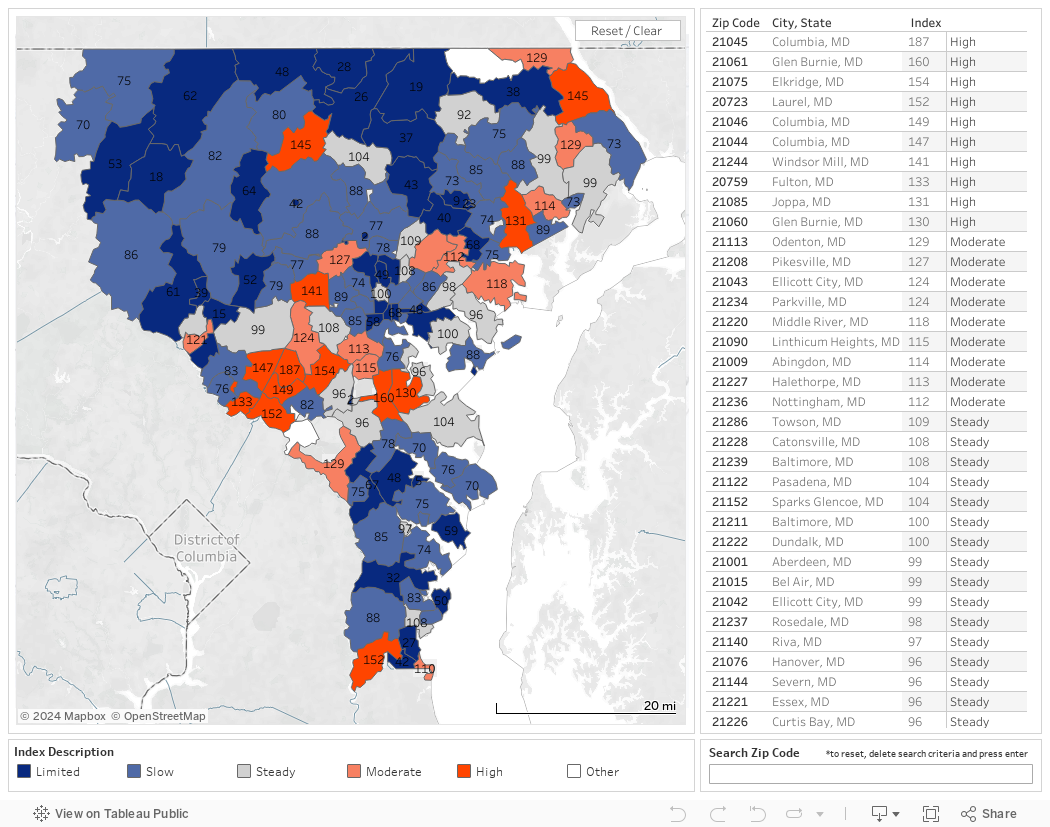
Home Demand Map
Across the Baltimore market area, one-fifth of ZIP codes recorded Bright MLS | T3 Home Demand Index scores of High or Moderate. Most of these areas were in a region stretching from Howard County northeast along the I-95 corridor. ZIP codes with a Steady Index score were scattered throughout the southeast portion of the market area. Areas with Slow buyer interest, accounting for about 35 percent of ZIP codes, were largely concentrated in the areas outside the core urban areas.
Bright MLS | T3 Home Demand Index
www.homedemandindex.com
Download tile as an image.
Embed this tile on your site.
Baltimore | January 2021
Demand and Inventory by Home Type
The Bright MLS | T3 Home Demand Index for the Baltimore market area fell for each type of home in December, which was consistent with the typical decline in buyer interest in the late fall and winter months. Except for the lowest-priced single-family home segment, buyer interest remained higher than one year earlier due to a combination of factors including favorable mortgage financing conditions and pent-up demand from earlier in the year. For would-be buyers, the number of homes available for sales was very tight. The months supply was at or below 1.5 months in each segment of the market except for higher-priced condos.
Bright MLS | T3 Home Demand Index
www.homedemandindex.com
Download tile as an image.
Baltimore | January 2021
Single Family Home Below $250k
Demand for single-family homes priced below $250,000 remained soft in December with a Bright MLS | T3 Home Demand Index score of 55. The Index fell by 14 percent over the month and by 28 percent compared to one year earlier. The low level of buyer interest in this segment was consistent with a pattern of weak demand since fall. Despite soft demand, the months supply was low at just 1.1 as most listings were rapidly snapped up further limiting overall buyer interest in a market segment with swift turnover.
Monthly Statistics for Single Family Home Below $250k
Home Demand Index
55
(Limited)
Home Demand Index from prior month
64
Home Demand Index from prior year
76
Months of inventory
1.1
Average daily inventory last month
367
Inventory sold last month
332
Bright MLS | T3 Home Demand Index
www.homedemandindex.com
Download tile as an image.
Baltimore | January 2021
Single Family Home $250k - $590k
The Index fell by 18 percent in December to a level of 87, reflecting a Slow pace of buyer interest in single-family homes priced between $250,000 and $590,000. While the decline reflects the expected seasonal pull back, demand for homes in this price range was still 30 percent higher than one year earlier suggesting solid buyer interest apart from month-to-month fluctuations. As a result, the months supply fell to just 0.8, inventory conditions that make it difficult for many would-be buyers to find a home and complete a transaction.
Monthly Statistics for Single Family Home $250k - $590k
Home Demand Index
87
(Slow)
Home Demand Index from prior month
106
Home Demand Index from prior year
67
Months of Inventory
0.8
Average daily inventory last month
1,015
Inventory sold last month
1,225
Bright MLS | T3 Home Demand Index
www.homedemandindex.com
Download tile as an image.
Baltimore | January 2021
Single Family Home Above $590k
The demand for single-family homes priced above $590,000 was 74 percent higher than one year ago, reflecting Steady buyer interest in this segment, which in December accounted for nine percent of all home sales in the Baltimore market area. Even with a decline in buyer interest over the month, inventory conditions were very tight with just 1.5 months of inventory available for sale.
Monthly Statistics for Single Family Home Above $590k
Home Demand Index
101
(Steady)
Home Demand Index from prior month
131
Home Demand Index from prior year
58
Months of Inventory
1.5
Average daily inventory last month
558
Inventory sold last month
381
Bright MLS | T3 Home Demand Index
www.homedemandindex.com
Download tile as an image.
Baltimore | January 2021
Condo Below $310k
Buyer interest in the lower-priced condo segment was Steady in December. Although much of the 12 percent decline in December reflected the usual easing of buyer interest at the end of the year, the Index was still 35 percent higher than the same period one year earlier. Lower mortgage interest rates and limited availability of similarly priced single-family homes supported buyer demand. As a result, the inventory of homes for sale in this segment was equivalent to just 1.4 months.
Monthly Statistics for Condo Below $310k
Home Demand Index
96
(Steady)
Home Demand Index from prior month
109
Home Demand Index from prior year
71
Months of Inventory
1.4
Average daily inventory last month
353
Inventory sold last month
253
Bright MLS | T3 Home Demand Index
www.homedemandindex.com
This is Tooltip!
Baltimore | January 2021
Condo Above $310k
The Bright MLS | T3 Home Demand Index for condos priced above $310,000 was down in December, but significantly higher compared with one year earlier, a pattern that has been in place during the past several months. Inventory conditions were more favorable than any other segment of the market with a 4.2 months supply.
Monthly Statistics for Condo Above $310k
Home Demand Index
134
(High)
Home Demand Index from prior month
160
Home Demand Index from prior year
59
Months of Inventory
4.2
Average daily inventory last month
159
Inventory sold last month
38
Bright MLS | T3 Home Demand Index
www.homedemandindex.com
This is Tooltip!
Baltimore | January 2021
Townhouse/Rowhouse/Twin All prices
Townhouse/ Rowhouse/Twin All prices
Buyer interest in the townhouse segment remained Steady in December even after accounting for the 15 percent decrease in December. Buyers unsuccessful in their search for homes in other similarly priced segments of the market likely contributed to demand for townhouse properties. The inventory of homes for sale was lean at just 1.2 months.
Monthly Statistics for Townhouse/Rowhouse/TwinAll prices
Home Demand Index
98
(Steady)
Home Demand Index from prior month
115
Home Demand Index from prior year
71
Months of Inventory
1.2
Average daily inventory last month
2,102
Inventory sold last month
1,809
Bright MLS | T3 Home Demand Index
www.homedemandindex.com
Note
1. This report is generated with data from the following counties: Anne Arundel, MD; Baltimore City, MD; Baltimore, MD; Carroll, MD; Harford, MD; Howard, MD
2. This report is for the January 2021 period with data collected from the previous month.
Released: March 4, 2021
Reference ID: 1017
Baltimore | January 2021
Home Demand Map (Zip Codes)
Across the Baltimore market area, one-fifth of ZIP codes recorded Bright MLS | T3 Home Demand Index scores of High or Moderate. Most of these areas were in a region stretching from Howard County northeast along the I-95 corridor. ZIP codes with a Steady Index score were scattered throughout the southeast portion of the market area. Areas with Slow buyer interest, accounting for about 35 percent of ZIP codes, were largely concentrated in the areas outside the core urban areas.
Bright MLS | T3 Home Demand Index
www.homedemandindex.com
Embed the Timeline
To embed the map on your website, copy and paste the code below. Please note that the ideal dimensions for displaying the map are 1312 pixels wide by 660 pixels high.
Embed the Map
To embed the map on your website, copy and paste the code below. Please note that the ideal dimensions for displaying the map are 1312 pixels wide by 1182 pixels high.
Embed the Housing Type Bar Chart
To embed the map on your website, copy and paste the code below. Please note that the ideal dimensions for displaying the map are 1312 pixels wide by 880 pixels high.